Week 43 Trade Update
Long Energy ETF XLE
I am long the Energy sector ETF XLE using call options. I covered the sector as part of my regular sector analysis last weekend. And as we have seen, the Energy and related sectors continue to do well.
Here is the 2022 chart for the XLE.
There is everything to like in the chart. The price has broken through 2 resistance levels in October alone and climbing towards its year-to-date high of 93 touched in June this year. The all-time high in the XLE is 100.
We have already seen from the research linked above that the XLE is perfectly bullish. That means the price is over the 10-day, 20-day, 50-day and 200-day moving averages. Plus, the 10-day has crossed the 20-day and the 50-day has crossed the 200-day moving averages. That is my system of defining an instrument perfectly bullish - it is not an industry standard.
The RSI is at 69 so likely some more room to run. The upper curve of the Bollinger band is still a couple of points above the price. Even if we have a small pullback, there will be room to run.
S&P 500 Review
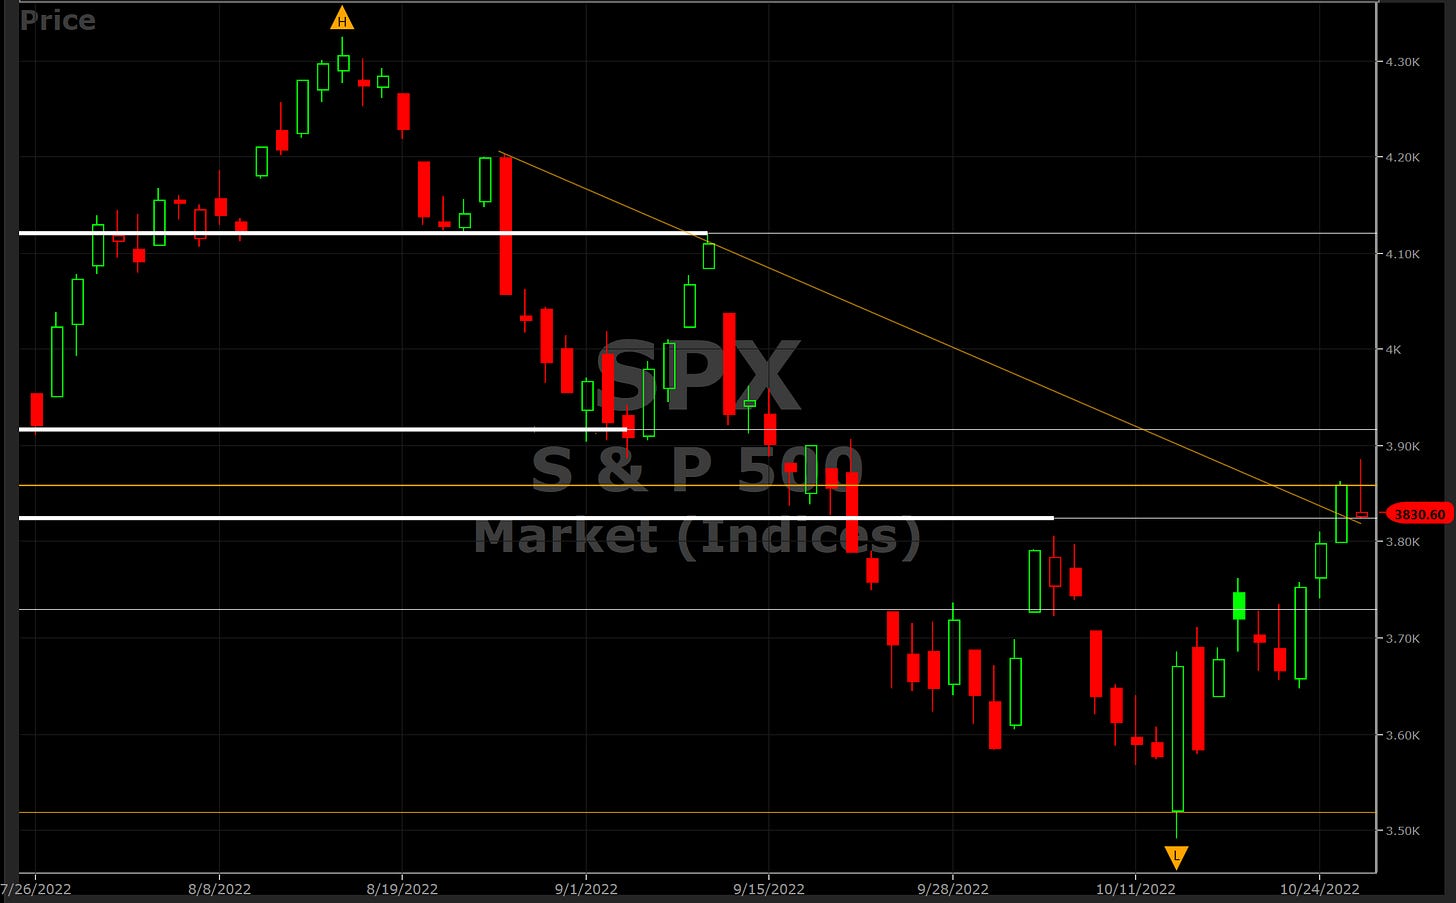
I charted out the S&P 500 3-month yesterday morning in my note. Here is an updated version with yesterday’s candle.
Couple of things to note in this chart:
The price touched the support at 3825 during the day and closed at 3830 - which is a test of support that it has passed for now.
In the chart from yesterday, I had connected 3 points starting from the high point reached August 16. If I draw the line from the last 2 high points, (as I have done above) then we are also testing that trendline. And, so far so good on that as well.
The probability of an upward move is still higher right now than otherwise because we did see the 10-day moving average cross over the 20-day moving average. Also, even though the markets were down yesterday, the Volatility VIX also fell. It has fallen 8 out of the last 11 trading days now - down from 33 to 27.
Last night META traded very poorly after its earnings release. So, Big Tech may continue to be a drag in the markets. This is also the reason we see the divergence in the markets. Yesterday:
The NASDAQ was down -2.04%
The S&P 500 was down only -0.74% and
The Russell 2000 was actually up +0.46%
So, all markets are not made equal. And the strength in the Russell 2000 gives me indication that there is a higher probability of markets going up (at least in the short-term).


