


Stock Market Sectors Trending and Performance
Let us review how the individual stock market sectors look like for this week. Many of the sectors moved in sync with the S&P 500. As expected, the Oil & Gas and Energy sectors are trending perfectly bullish. Interestingly, the next best sectors are Metals & Mining, NA Natural Resources and Healthcare. The Homebuilders and US Home Construction sectors are trending perfectly bearish.
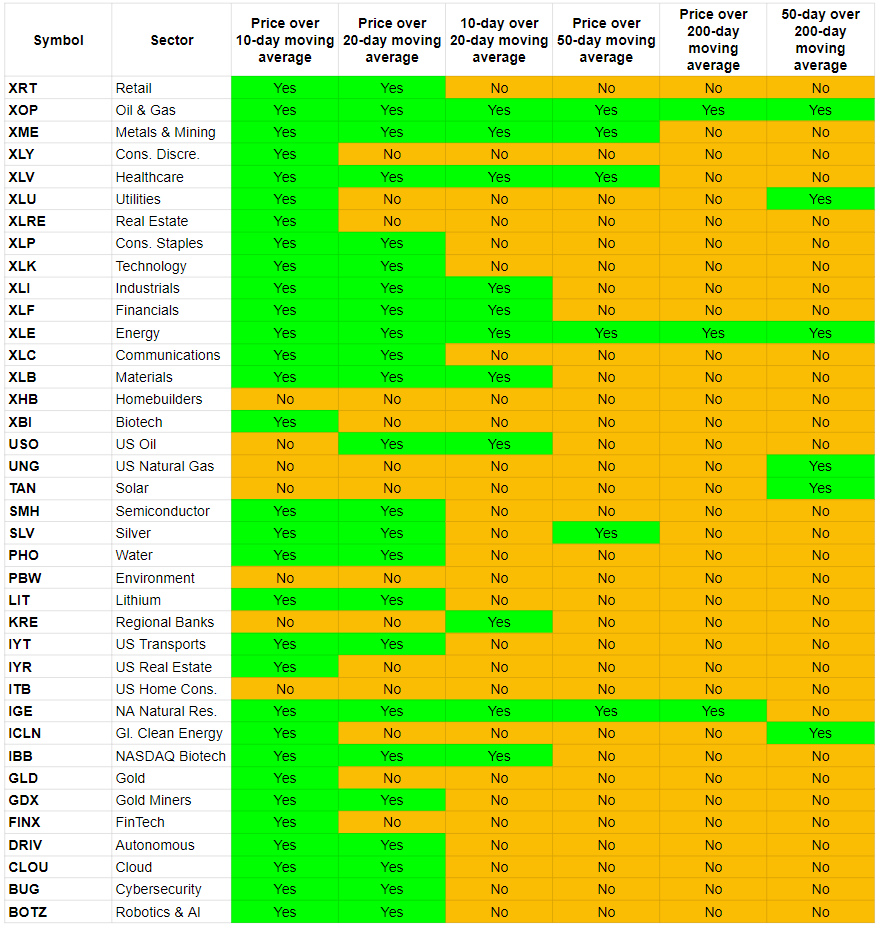
The Retail sector XRT price has crossed over the 10-day and 20-day moving average in line with the S&P 500.
The Oil and Gas sector XOP has turned perfectly bullish.
The Metals & Mining sector XME is trending short-term bullish. The price has also crossed over the 50-day moving average.
The Consumer Discretionary sector XLY is lagging the market. The price has crossed over only the 10-day moving average.
The Healthcare sector XLV is trending short-term bullish. The price has also crossed over the 50-day moving average.
The Utilities sector price just crossed over the 10-day moving average. Note that it never turned long-term bearish as the 50-day moving average stayed over the 200-day moving average.
The Real Estate sector XLRE is lagging the market. The price has crossed over only the 10-day moving average.
The Consumer Staples sector XLP price has crossed over the 10-day and 20-day moving average in line with the S&P 500.
The Technology sector XLK price has crossed over the 10-day and 20-day moving average in line with the S&P 500.
The Industrials sector XLI has turned short-term bullish.
The Financials sector XLF has turned short-term bullish.
The Energy sector XLE has turned perfectly bullish.
The Communications sector XLC price has crossed over the 10-day and 20-day moving average in line with the S&P 500.
The Materials sector XLB has turned short-term bullish.
The Homebuilders sector XHB has turned perfectly bearish.
The Biotech sector XBI seems to be lagging the market. This week’s returns were lukewarm, and it is also negative for the month-to-date. (See below).
The US Oil price USO is not trending at all. No change in trending from last week. This week’s change was negligible. (See below).
The US Natural Gas UNG also did not show any change in its trending. It fell hard this week. (See below).
The Solar sector TAN also did not show any change in its trending.
The Semiconductor sector SMH price has crossed over the 10-day and 20-day moving average in line with the S&P 500.
The Silver metal SLV showed some strength with price crossing over the 10-day and the 20-day moving averages. Big returns this week (See below).
The Water sector PHO price has crossed over the 10-day and 20-day moving average in line with the S&P 500.
The Environment sector PBW continues to trend perfectly bearish.
The Lithium sector LIT price has crossed over the 10-day and 20-day moving average in line with the S&P 500.
The Regional Banks sector KRE price fell below its 10-day and 20-day moving averages. Looks weaker than the general markets.
The Transports sector IYT price has crossed over the 10-day and 20-day moving average in line with the S&P 500.
The US Real Estate sector IYR showed little strength with the price crossing over its 10-day moving average. That looks weaker than the rest of the markets though.
The US Home Construction sector ITB has turned perfectly bearish similar to the Spider Homebuilders sector XHB.
The North America Natural Resources sector IGE showed strength and turned short-term bullish. The price also crossed the 50-day and the 200-day moving averages.
The Global Clean Energy sector showed minor strength with the price crossing over the 10-day moving average.
The NASDAQ Biotech sector IBB turned short-term bullish.
The Gold metal GLD looked weak even though the price did cross over the 10-day moving average.
The Gold Miners sector GDX looks only a little better than the gold metal. The price has crossed over the 10-day and 20-day moving averages.
The FinTech sector FINX seems to be underperforming the rest of the markets. The price just crossed over the 10-day moving average.
The Autonomous and Electric Vehicles sector DRIV price has crossed over the 10-day and 20-day moving average in line with the S&P 500.
The Cloud sector CLOU price has crossed over the 10-day and 20-day moving average in line with the S&P 500.
The Cybersecurity sector BUG price has crossed over the 10-day and 20-day moving average in line with the S&P 500.
The Robotics & AI sector BOTZ price has crossed over the 10-day and 20-day moving average in line with the S&P 500.
Here is the performance of the sectors week over week.
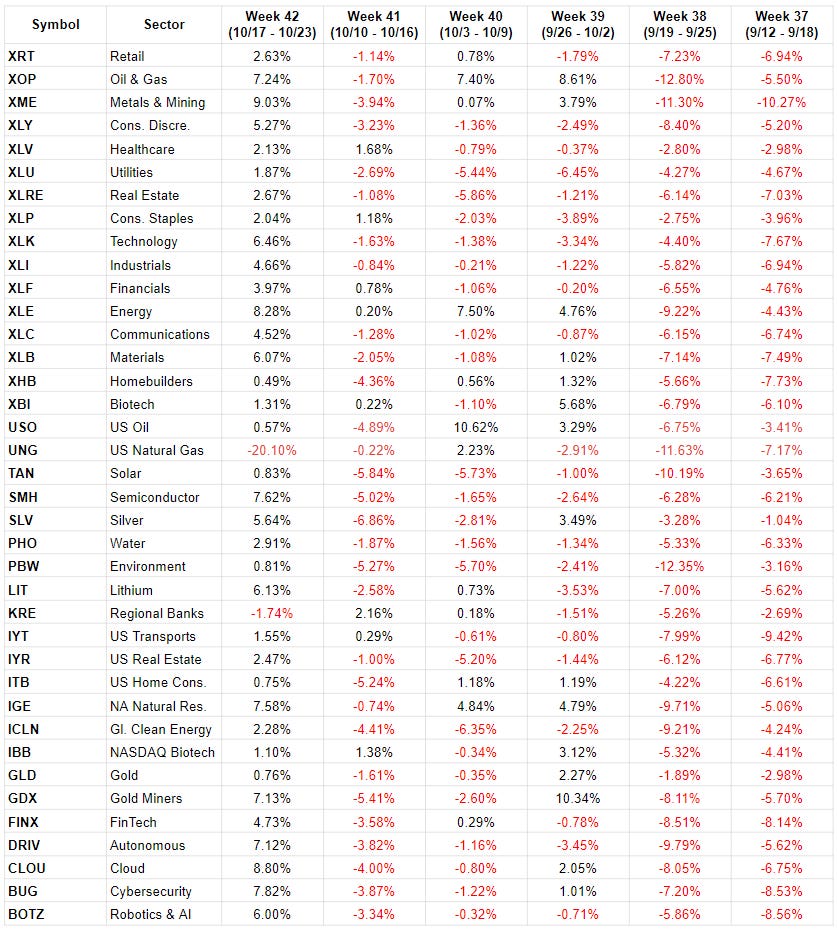
Mostly a strong week. Here is another view of ROI.

Observations:
One would expect the Oil & Gas XOP and Energy XLE to be doing well through the year and that is true. However, so have the Metals & Mining sector XME and the NA Natural Resources sector IGE. Both have positive returns for all periods.
The North America Natural Resources IGE has actually a healthy +25% return for the year so far. I definitely need to research this instrument more deeply to identify what are the underlying components.
For all the hype around FinTech FINX has performed worse than both the Financials XLF and the Regional Banks KRE. Earlier in July I had done a quick assessment of XLF, FINX and ARKF and identified that the FinTech space is not living up to the hype from a return’s perspective.
Reviewing the week by week returns of the sectors, it looks mostly similar to the major markets as expected. We have had a positive week after 5 weeks of losses.
Innovation has had a very tough time through this year. We know that from the performance of the ARK funds (not covered here) but also from the last 5 sectors in the table above which are components of innovation. I should add the ARK Innovation fund to my analysis as well.
There are 5 sectors that can be considered as ESG related. Looking at year to date performance, Solar TAN and Global Clean Energy ICLN have performed better than the S&P 500 - meaning fallen less than the S&P 500. The Lithium sector LIT, and Water PHO have performed similar to the S&P 500 while the Environment PBW has performed worse than the S&P 500.
Conclusions:
The Energy XLE and Oil & Gas XOP remain as areas where new capital can still be deployed.
Homebuilders XHB and US Home Construction ITB are not to be touched or played to the short side.