Week 21 SPX Sectors Trending and Performance
Summary
Only 3 of the 11 sectors are trending bullish and they make 44% of the S&P 500. The S&P 500 eked out gains last week just on the basis of the XLY, XLK and XLC. These 3 sectors are also the only winners in the month of May so far, again delivering minor positive returns for the S&P 500. The question is whether this can continue.
There is an expectation that with the deal to raise the debt ceiling all but assured, the markets will take off after that actually happens. However, the deal could already be priced in, and we may not get the bounce we are expecting.
The XLK looks overbought, and several other sectors look weak. So, the risk seems to be on the downside. Although, in my review of the major markets, I said S&P 500 looks like it wants to go higher. That tells me I have no edge and I should not play the markets until I can clearly see something. Right now, I can’t.
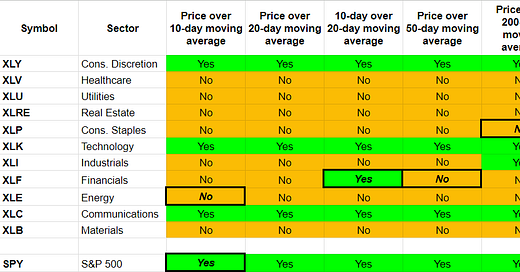
Trending Heat Map
Perfectly Bullish (3): XLY, XLK, XLC
Short-term Bullish (1): XLF
Short-term Bearish (4): XLV, XLI, XLB, XLP
Perfectly Bearish (3): XLU, XLRE, XLE
On the face of it, 7 out of 11 sectors are trending bearish. However, this is somewhat misleading as the sectors are not equal weight. Here is the current weight:
This tells us that bullish sectors make up 57.1% of the S&P 500 and bearish sectors make up 42.9% of the S&P 500. This is why S&P 500 is trending higher.
Performance
If we look at the May and the year-to-date numbers from above table, it tells us the story about the 3 sectors that are lifting up the S&P 500. These 3 sectors are just 44% weight in the S&P 500, but due to their outsize performance have managed to keep the S&P 500 higher. All other sectors are negative.
Here is the week-over-week performance for last 6 weeks:
The last week is an exact replica of the May numbers. The 3 sectors holding up the S&P 500 through their outperformance. Note that I listed XLF as trending short-term bullish in the trending section. While that is technically true per my system, the moving average trendlines are very much bunched up together to render that characterization meaningless. It is more appropriate to say XLF is trending bearish.


