

Week 21 Major Markets Trending and Performance
Summary
The SPY made a new year-to-date high. The QQQ is also at a 1-year high. The IWM maintained its short-term bullish trending. The Dow Jones maintained its short-term bearish trending. Overall, the markets maintained its wide divergence in trending between the select tech stocks and the rest of the stocks. The short-term bullish trending in the IWM does indicate a little wider participation from non-tech stocks.
Expected immediate price movements:
The following is based on chart observations and indicates expectations for the next few days to the end of next week.
SPY higher
QQQ lower
IWM lower
DIA higher
EEM higher
FXI lower
The first 4 are US markets and with 2 going higher and 2 going lower indicates it is still a very even market and difficult to trade. With 3 out of 4 trending bullish to somewhat bullish I would say probability of higher is higher.
Trending Heat Map

Chart Observations
SPY: With the last 2 strong trading days, the SPY came very close to filling the long-standing unfilled gap above. The high price Friday was 420.77 and the gap is at 421.22. The current price at 420.02 needs to rise +0.29%. With the price trending looking good, it looks inevitable that this gap will get filled next week. The RSI and Bollinger bands are at reasonable levels. The MACD line just crossed over the signal line turning the histogram positive. Looks like SPY will go higher.
QQQ: The RSI and Bollinger bands are indicating overbought situation. With the move up in the last 2 trading days, it has created an unfilled gap below at 332.90 which is -4.45% below current levels. The MACD histogram is at 3-month divergence levels. That does not mean price cannot keep going further up. It means that the probability of price taking a breather is higher.
IWM: Price moved higher on Friday, but the MACD histogram worsened showing us some divergence in trending. RSI and BB are ok. There are 2 unfilled gaps above, the first of which is at 177.38 (up +0.7% from current level). There is an unfilled gap below at 171.56 which is -2.61% below current level. The chances of price going up or down seem even at this time. Just looking at the MACD I would pick price going down.
DIA: Price moved nicely higher Friday. It did not change the trending but improved the MACD histogram which is now trying to become positive. The RSI and Bollinger bands are indicating somewhat oversold levels. There is an unfilled gap below at 322.46 which is -2.53% below current level. However, looking at the MACD, I consider the chance of going up higher.
EEM: Price gapped up Friday leaving an unfilled gap below at 38.51 which is -1.26% below current level. There is an unfilled gap above at 39.26 which is +0.67% above current level. The RSI and Bollinger Bands are at reasonable levels. The MACD is below the signal line but trying to come up. Price looks more likely to move higher from here.
FXI: Price closed the first unfilled gap above on Friday action. There are multiple gaps below as well as above. So, the question where does the next price momentum take us? The RSI and BB are at close to oversold levels. However, even though price action was good on Friday the MACD histogram widened to the downside. The trending worsened so we assume price movement probability is higher to the downside.
Performance

The wide divergence in the markets is evident in the performance numbers. Everyone is waiting for either the QQQ to ease down or the rest of the markets to catch-up. That has not happened this while year so far. The markets are teaching us (again) that it will do what it wants to do. And players have to play by its rules.
Weekly Performance
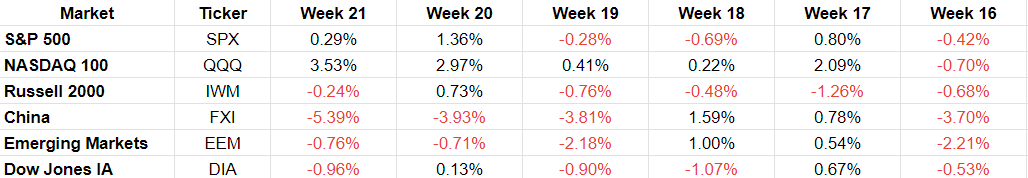
The QQQ is up 5 weeks in a row. The SPY is up 2 weeks after being down 2 weeks. The IWM has had 5 down weeks in the last 6. The DIA has 4 down weeks in the last 6. The FXI and EEM are down 3 weeks in a row.
There is no clear pattern, but one does wonder whether QQQ will make it 6 up weeks in a row. Based on the analysis earlier also the probability seems higher for QQQ to be lower next week. The issue is that the QQQ components are the ones also propping up the SPY. So, how does QQQ go lower and SPY higher. That is at the core of the tension in the markets right now.
Expected Weekly price moves:
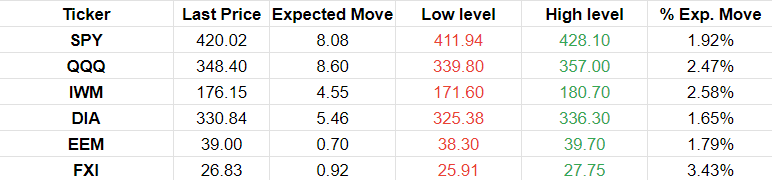
These are the expected price moves through Friday June 2.