


Week 7 Alternate Sectors Trending and Heat Map
Let us start with the current Trending Heat Map
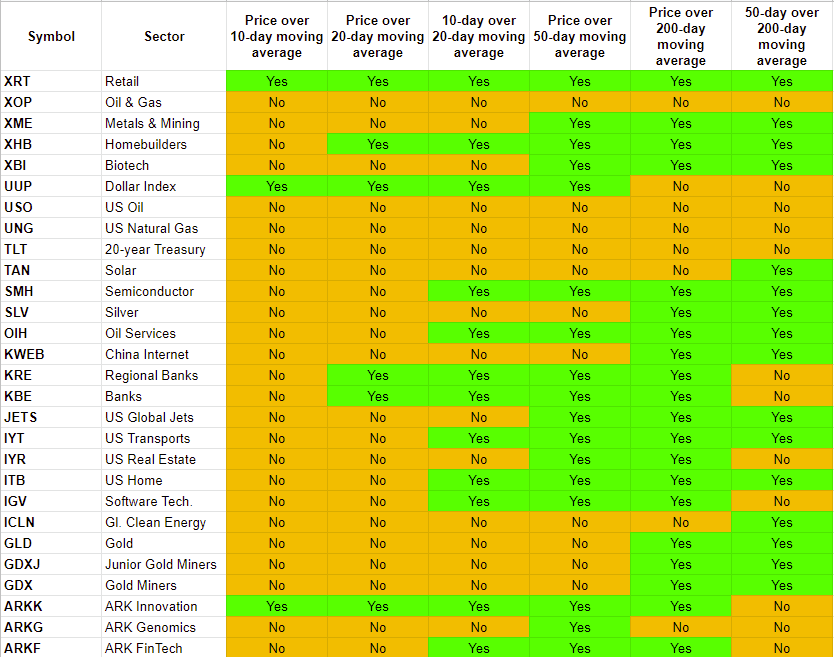
XRT improved from last week.
XOP worsened and is now perfectly bearish.
XME worsened a bit and turned short-term bearish.
XHB no change.
XBI worsened a bit and turned short-term bearish.
UUP no change.
USO worsened and is trending short-term bearish.
UNG worsened and went back to perfectly bearish.
TLT no change. Remained perfectly bearish.
TAN no change.
SMH worsened slightly.
SLV no change.
OIH trending worsened a bit.
KWEB no change.
KRE no change.
KBE no change.
JETS trending worsened and is short-term bearish now.
IYT worsened a bit.
IYR trending worsened and is now short-term bearish.
ITB trending worsened a bit.
IGV trending worsened a bit.
ICLN no change.
GLD trending worsened a bit.
GDXJ no change.
GDX no change.
ARKK trending improved and is now short-term bullish.
ARKG trending worsened and is now short-term bearish.
ARKF no change.
Trending getting better (2): XRT, ARKK
Trending getting worse (14): XOP, XME, XBI, USO, UNG, SMH, OIH, JETS, IYT, IYR, ITB, IGV, GLD, ARKG
Note that the instruments are a mix and should not all be correlated with the broader market. For example, UUP the Dollar Index going up may be bad for stocks, etc.
However, an overwhelming number of sectors trending got worse last week.
Let’s review the performance of these sectors.

Quick Observations:
Dollar going up, stocks, precious metals and commodities going down.
Banks and ARK Innovation has held up so far in February when all else have gone down.
One would think UNG is done losing and ripe for a bounce-back. But market thinks otherwise.
XRT, XME, XHB, SMH, JETS, ARKK, ARKG and ARKF have retained most of their gains from January. If one wants to play any of them to the short side, the worst trending is seen in JETS and ARKG.