


Week 49 Global Markets Trending and Performance
Trending Heat Map

There is not a lot of change in the trending of global markets. I do see some weakness but still not a whole lot. Definitely not as much as I saw in the US markets. Mexico is turning slightly bearish. And India also seems to be weakening. Hong Kong and China seem to remain strong as of now. We did see the relative strength of the Emerging Markets as well.
Week-over-Week Performance
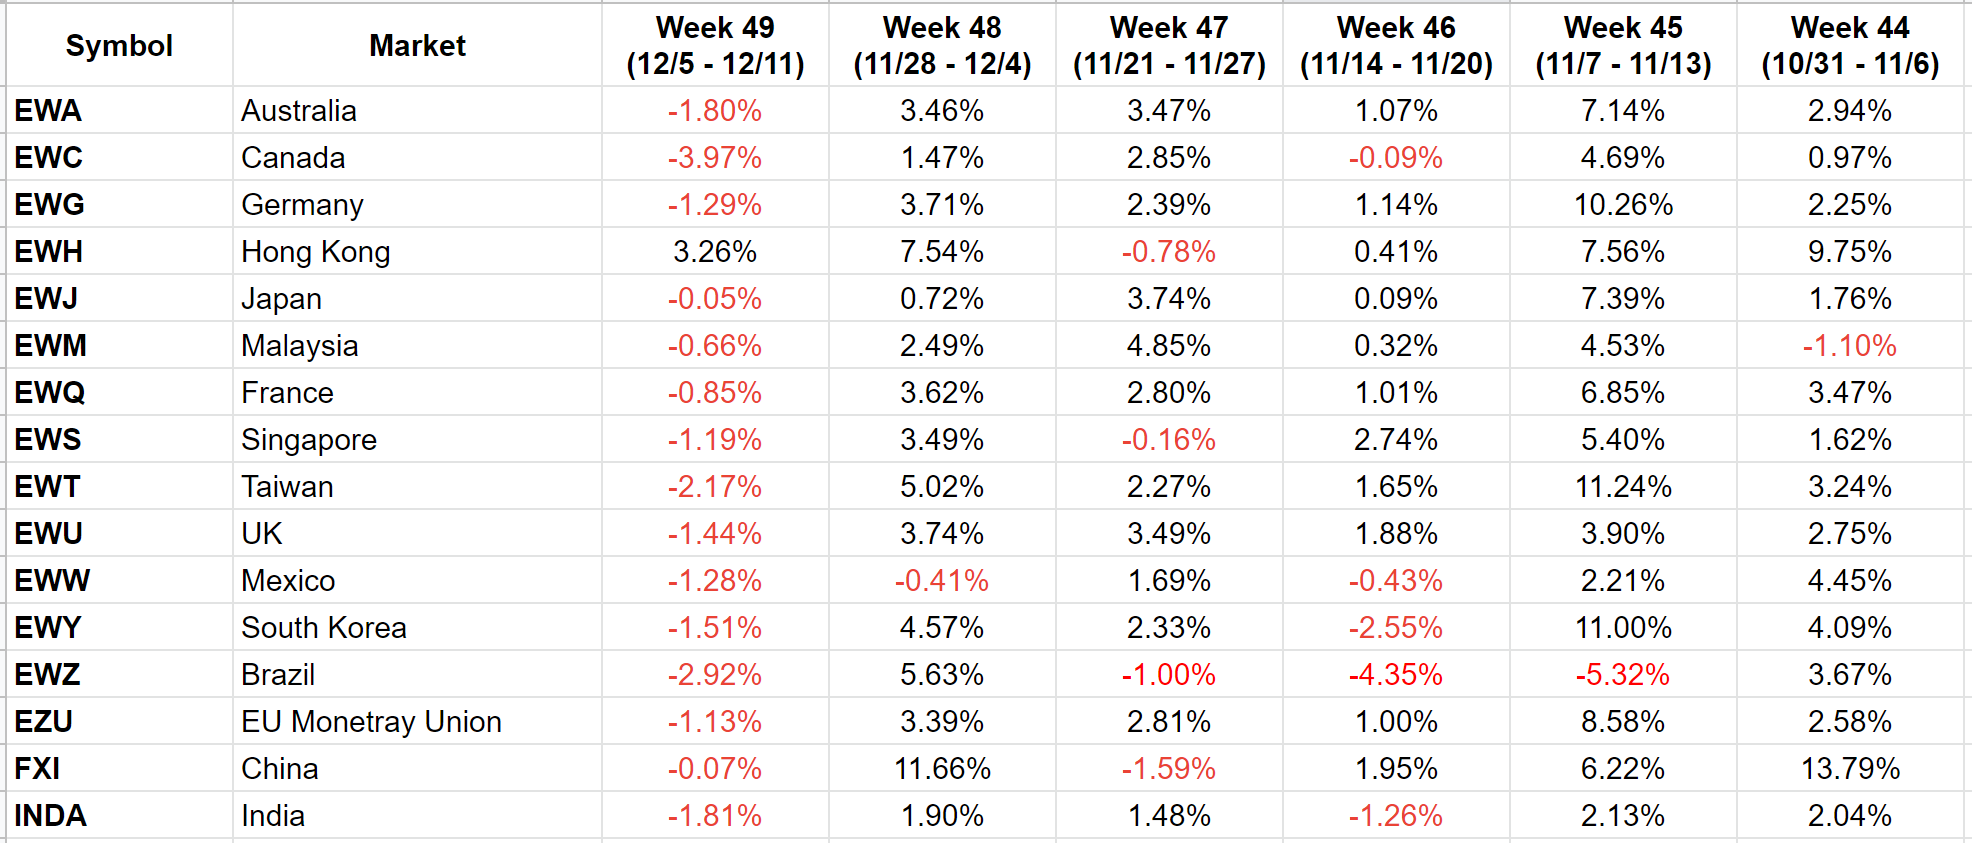
Hong Kong is the outlier. All other markets were down. Hong Kong is now up 5 out of last 6 weeks. China was down very little after the massive gains the prior week. So, as with the trending heat map, we can see that China and Hong Kong are outperforming the other global markets.
Performance 2022

The recent strength of China and Hong Kong shows in the numbers. Mexico and Brazil have done well through the year, but their recent price trend is weak. Interestingly, on a relative basis, Australia, Canada, Hong Kong, Malaysia, France, Singapore, UK, Mexico, Brazil and India have all performed better than the S&P 500 over the year.
Technical Observations
Hong Kong EWH looks strong after gaining +25% almost in a straight line. It has left a few gaps along the way which will need to be filled at some point in time. For now, the strength may take it above 22. The 150-day has not yet started making the curve to indicate a bearish to bullish reversal though. Here is the chart.

China FXI price is up +38% from its low just about a month back. That is a very steep climb in a very short timeframe. Just in principle, I would not put new money on it. There are those unfilled gaps below that will need to be filled at some point. The 150-day does not indicate a bottoming curve yet. Here is the chart.

Eurozone EZU has a better bottoming curve on the 150-day. There is still an unfilled gap that worries me. The chances of going up or down from here seem even. The challenge will be that other markets seem to have higher probability of going down and so they can drag this down as well. Here is the chart.

Japan EWJ price is hovering above the 150-day trendline. The trendline has not yet completed a bottoming curve to indicate a bearish to bullish reversal. There is also an unfilled gap below that needs to be filled at some point in time. Not a fan yet. Here is the chart.

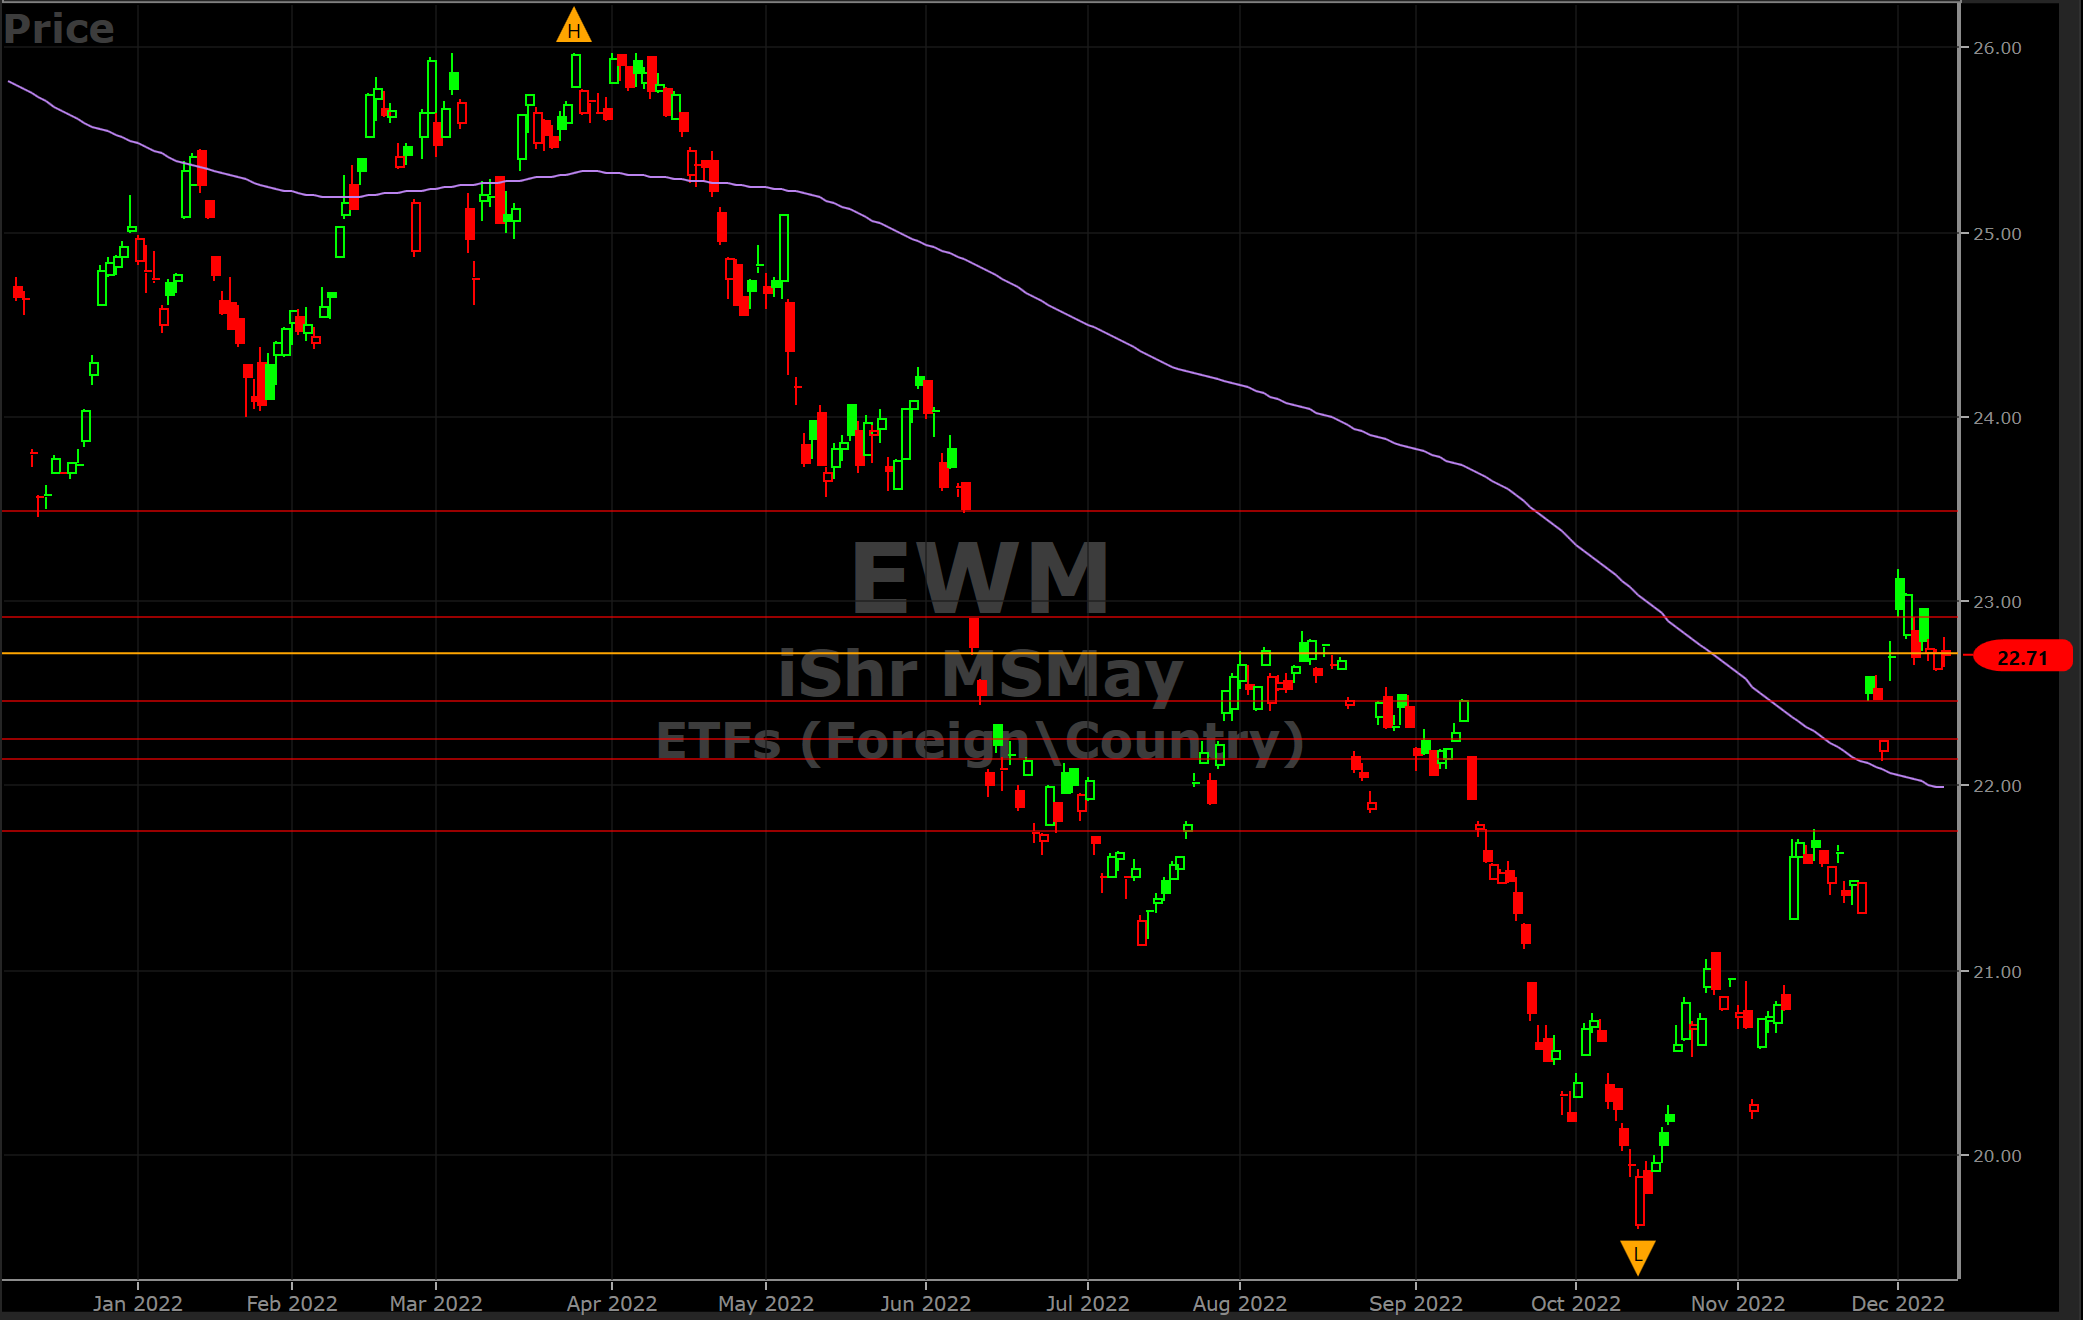
Malaysia EWM has so many unfilled gaps that the question is which one gets filled first. It tried to fill the gap above between 22.91 and 23.49 but failed for now. (See the red horizontal line pairs for the gaps). It could be on its way to fill the gap(s) below. Here is the chart.
Mexico EWW is a strange and volatile one. I pulled the chart duration to way back in order to show the price movement against the 150-day. That is the only way one can make any sense of it. Anyway, it is not for me. Here is the chart.

India INDA is interesting. I have drawn a thick horizontal line above at around 44.37 mark to indicate resistance above. I have also drawn 3 green lines indicating a reverse head and shoulders below. That could indicate a bullish reversal is on the cards. The reversal happened but stalled at the resistance line. The question is which direction the price goes now. The 150-day is somewhat indicating a bullish reversal as well. Certainly, something to watch. Here is the chart.