


Week 46 Leveraged Instruments Trending
SPXL is the 3x leverage of the S&P 500 and I clearly see a downward bearish channel. I am in the process of buying SPY puts (started Friday) and will likely add to it next week. SELL. Here is the chart:

TNA is the 3x leverage of the Small Cap stocks. It seems stalled again on its 150-day moving average just as it did in August. The support is at 30 which does not seem a lot but is down -20% from current levels. WATCH for downside trade. Here is the chart:

EDC is the 3x leverage of the Emerging Markets. The chart tells you the story. I expanded to 2 years to show it better. AVOID or use EDZ to go long. That is the inverse instrument. Here is the chart:

TECL is the 3x leverage of the Technology sector. It has a similar downward channel like the SPXL. Not good. SELL now or when price touches around 30. Or go long TECS which is the inverse instrument. Here is the chart:

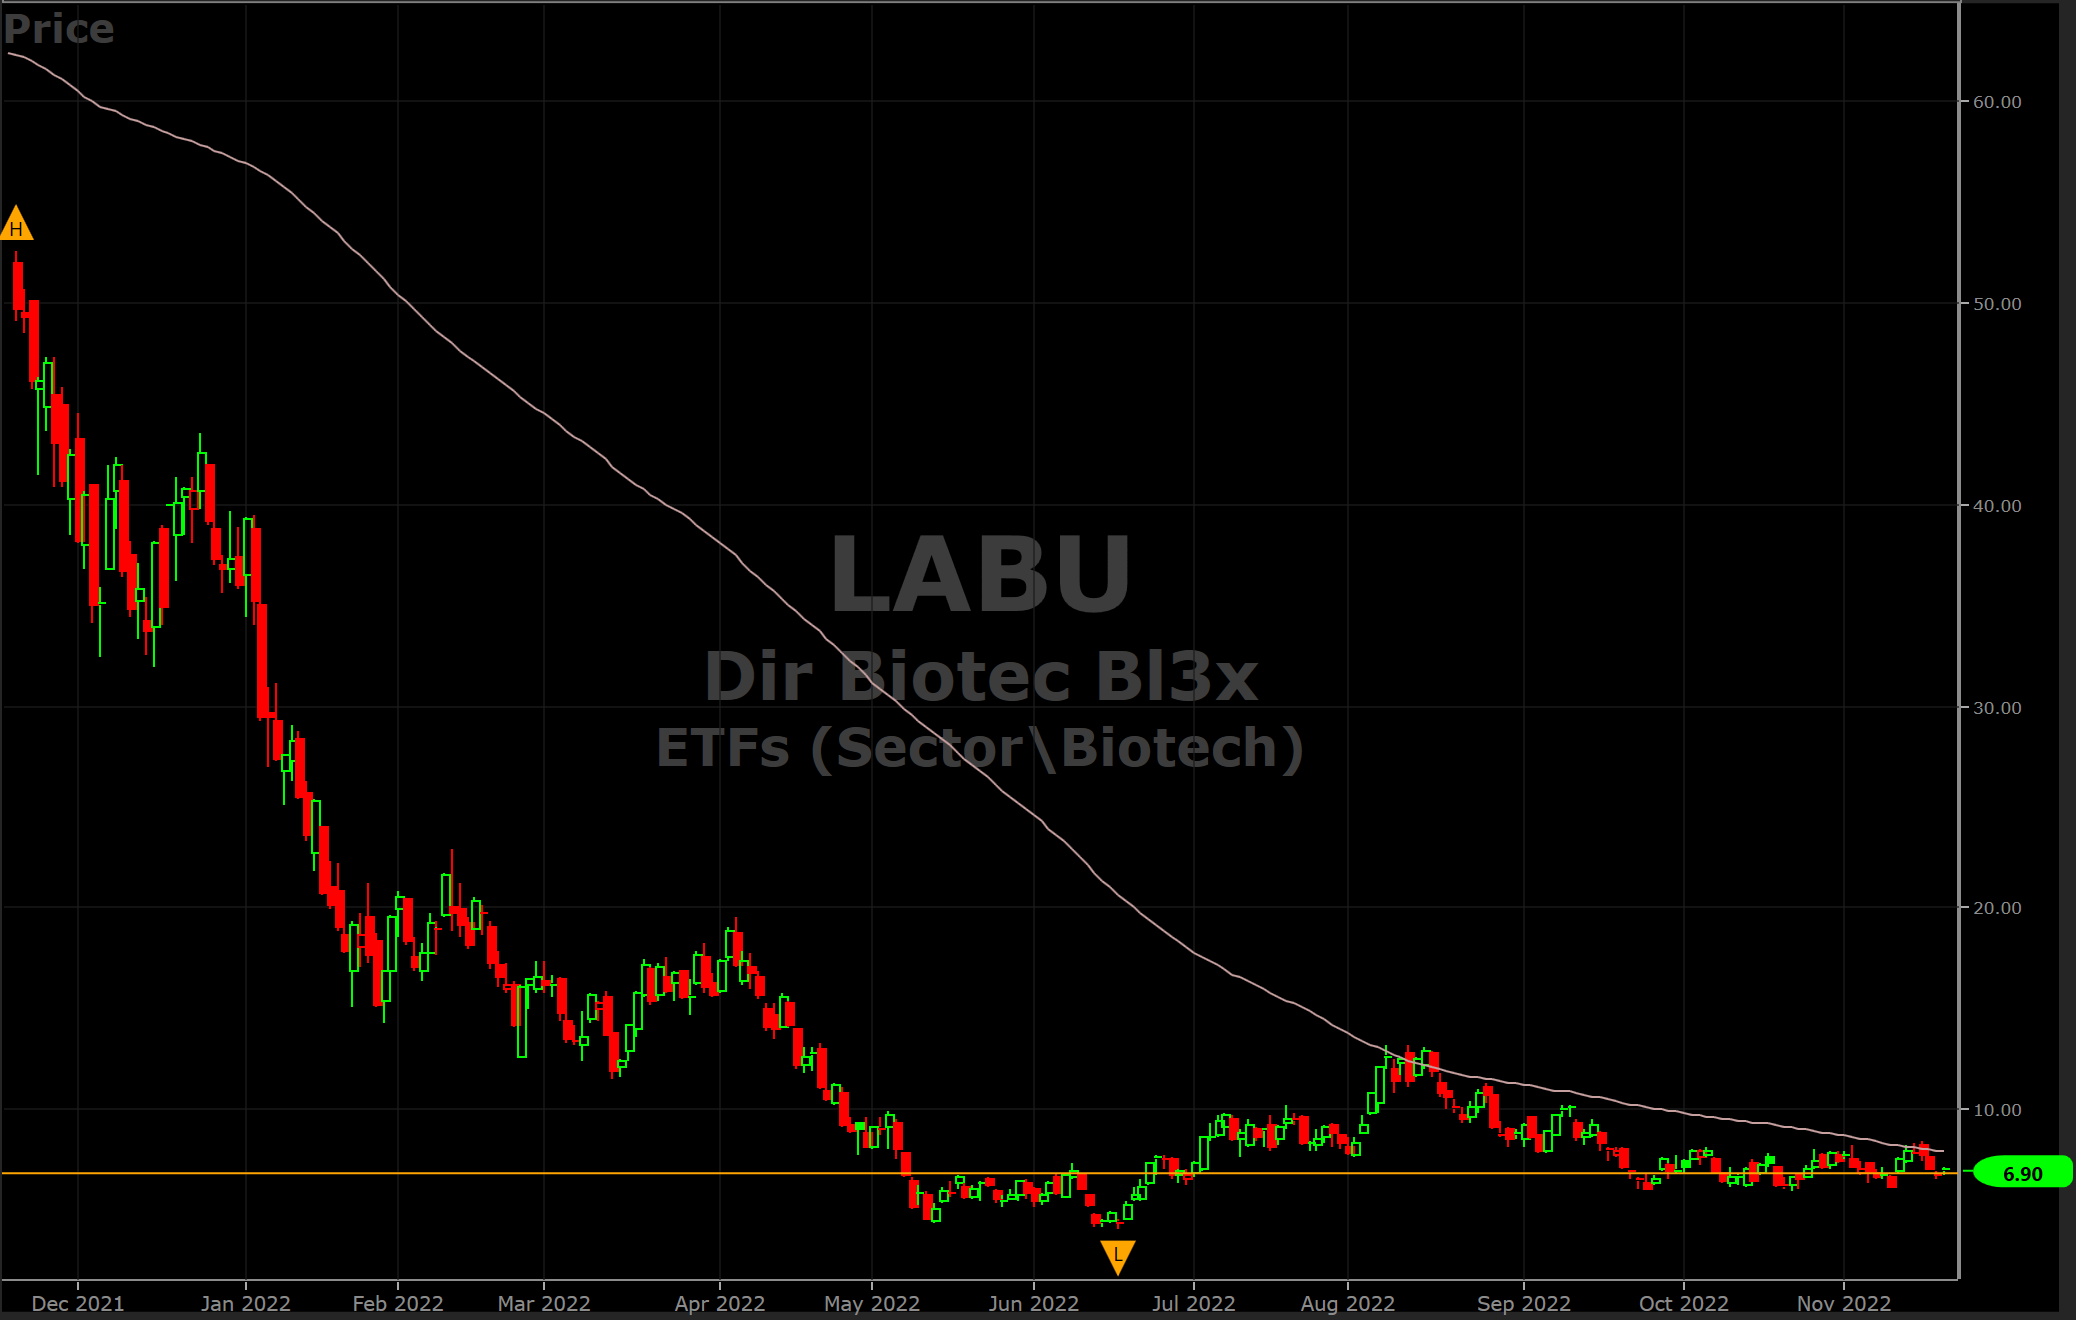
LABU is the 3x leverage of the Biotech sector. Is it going through a bottoming exercise? Looks like that to me. The price has started hugging the 150-day and a strong support base seems to be created. WATCH for going long. Here is the chart:
BNKU is the 3x leverage of the Big Bank sector. It looks to be making a bearish to bullish reversal. The support is at around 25 and the resistance at around 35. The price currently sits at 30 perfectly in the middle. The price also sits in the middle of the Bollinger bands. WATCH for long play.
GDXU is the 3x leverage of the Gold Miners. It looks like in the early stages of the bearish to bullish reversal. I actually took a position in this already and could be I was a little early. The chart pattern does look like a bottoming exercise. The price is in the middle of the Bollinger bands. I will HOLD my position for now.
NAIL is the 3x leverage of the Homebuilders. It looks like making a bearish to bullish reversal. The price has been hovering between 20 and 30 with the 150-day at around 31. It is in the middle of the Bollinger bands. WATCH for long play.
SOXL is the 3x leverage of the Semiconductor sector. It looks like starting to make a bearish to bullish reversal. A base could have been set around the 8 level as a downside support. The price is at 12.49 and the 150-day is at 16. WATCH for long play.
RETL is the 3x leverage of the Retail sector. It looks like in a bottoming exercise and trying to do a bearish to bullish reversal. It could spend a little more time between 6 and 9 though before any breakout materializes. It is currently at 8.7. So, if it can bounce out of the 9 - 10 level, I will consider the bullish reversal in place. For now, just WATCH.