Week 44 Major Markets Trending and Performance
We had a bit of a roller-coaster this week. I had posted the trending changes earlier this week just after the Fed meetings. Let’s see how it looks like now.
Trending Heat Map
It is an interesting trending heat map. The Emerging Markets EEM and the All-Country World Index ACWI improved their trending while the Dow Jones, S&P 500 and Russell 2000 stayed more or less steady and the NASDAQ and NASDAQ 100 worsened.
We have a bit of a divergence in the major markets right now. We will need to see if the EEM and ACWI strength can lift up the US markets or the US Markets (especially technology) weakness brings down the world markets.
Week-over-Week Returns
The Emerging Markets EEM really had a very strong week. And as we noted from the trending heat map, the NASDAQ and NASDAQ 100 were the weakest. After 2 weeks of positive returns, the 3rd week is negative again. The global markets seemed to hold on well. The EEM is now positive 3 weeks in a row.
ROI over different periods
The 1-month ROI more or less reflects the trending we saw above. The Dow Jones and Russell 2000 clearly are the leaders in the US markets. The NASDAQ (Technology heavy) continues to do poorly. The 3-month negative ROI in the NASDAQ of -17% is very glaring.
Next, I want to review some more technicals on the S&P 500 and the NASDAQ 100 QQQ which are the ones I have been trading recently.
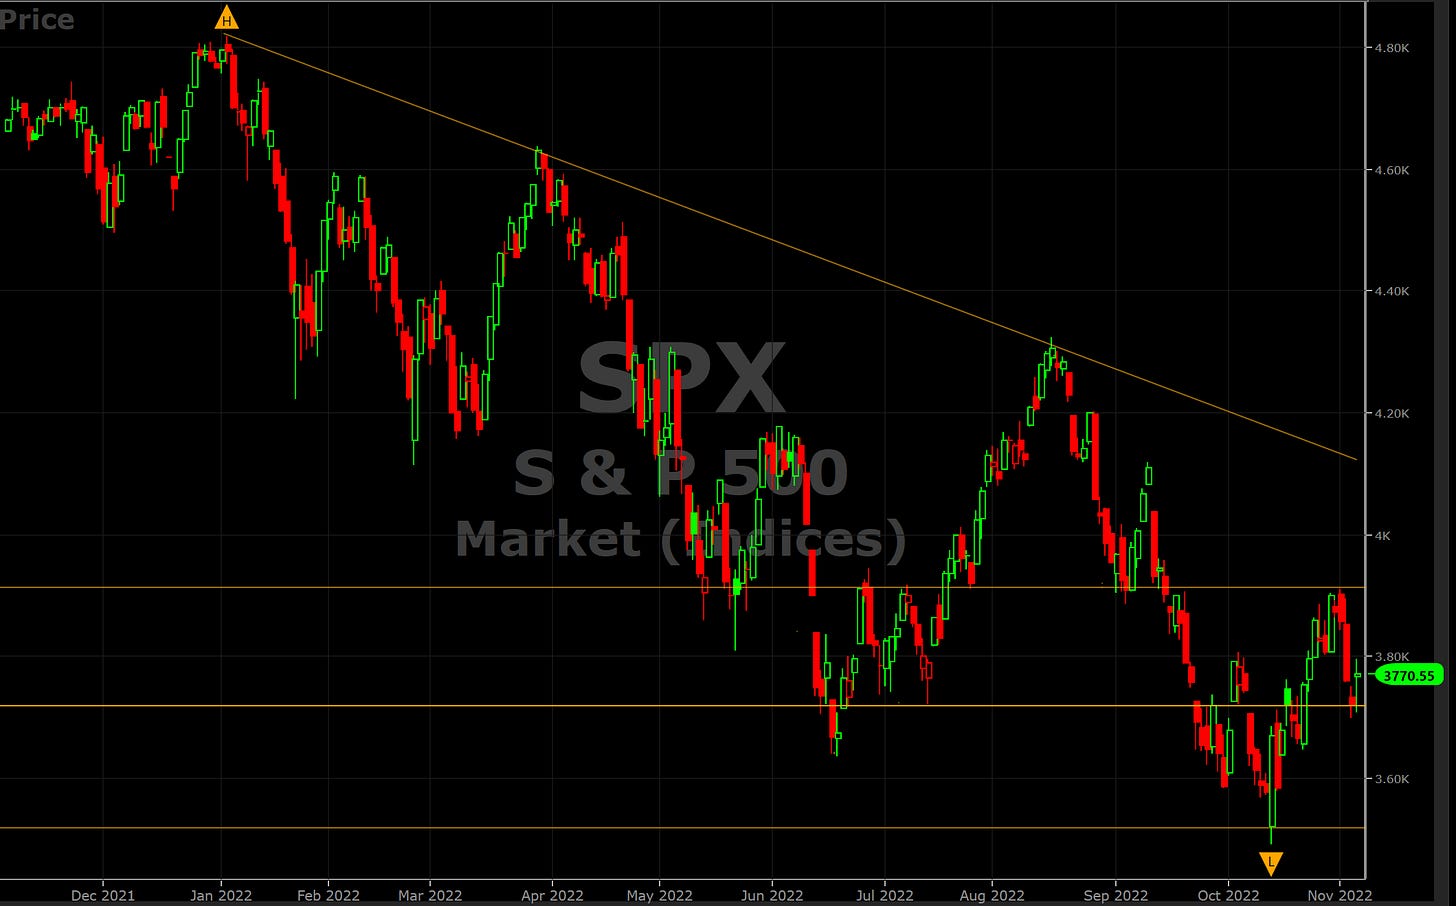
S&P 500 1-year chart
That trendline looks very much like a downward channel. The price certainly has a long way to go before we can claim to have a meaningful reversal to the upside. We can see every time it has tried to bounce it has made a lower high and lower low. There is support at 3719 and resistance at 3913.
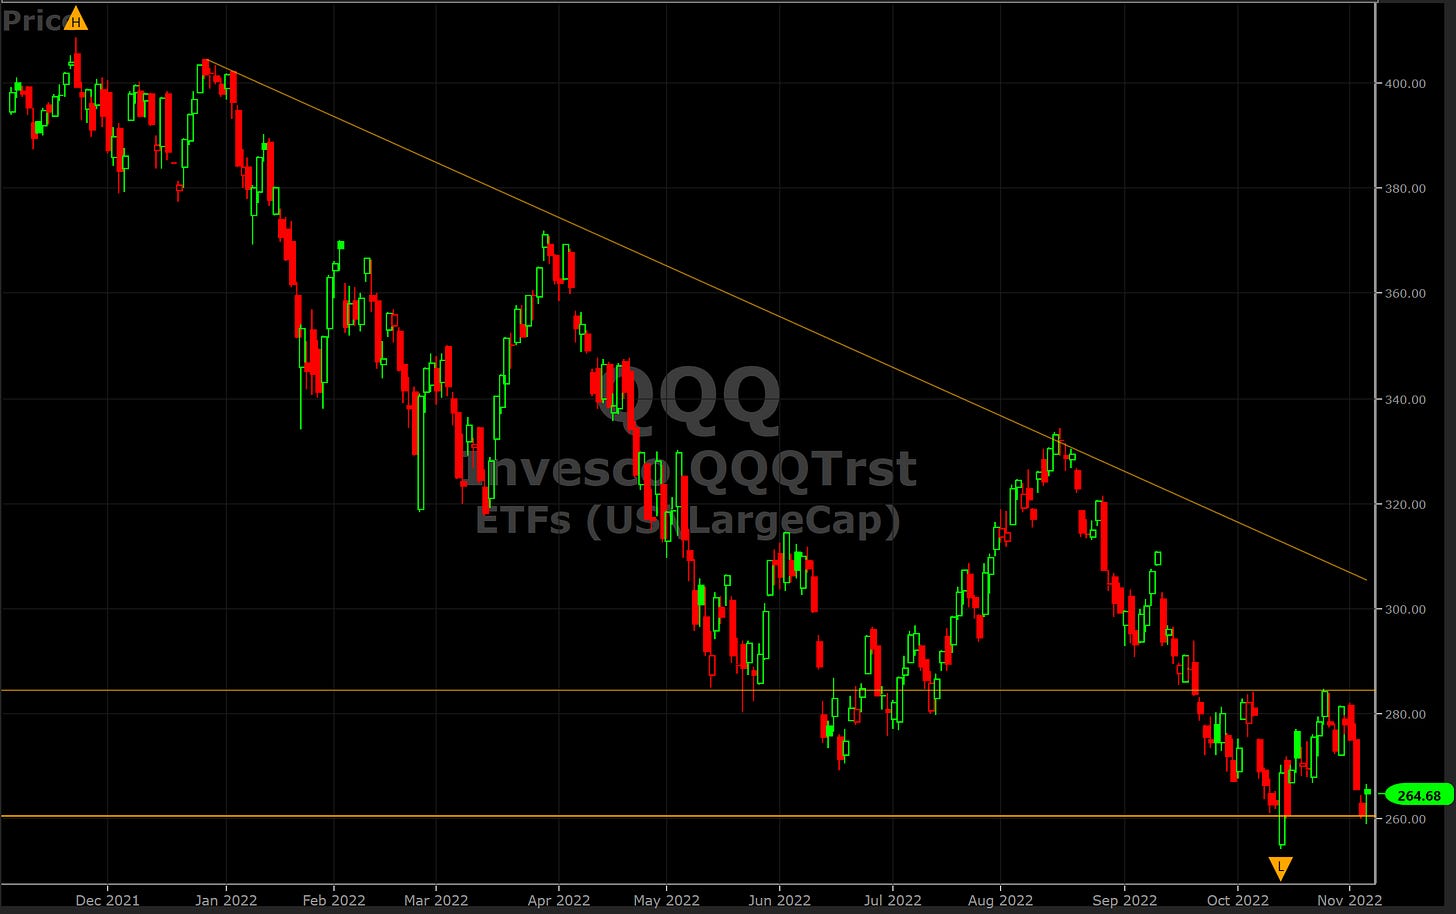
NASDAQ 100 QQQ 1-year chart
The price movement is similar to the S&P 500 which is movement in a downward channel with lower highs and lower lows. The support is at 260 and the resistance at 284.
Conclusion
The upward trend that was started from middle of October has dissipated. The risk is back to the downside. There is a good chance we make new lows within the next several days/weeks as I do not see any catalyst to pull the markets back up in the short-term.
We have had 5 weeks of negative ROI (Week 37 - 41), then 2 weeks of positive ROI (Week 42 - 43) and Week 44 is back to negative ROI. So, it seems like 1 step forward and 2 steps back at this time for the markets.


