Week 43 Major Markets Trending and Performance
Week 43 is over. Hard to believe only 9 weeks left in the year. OK, let’s get to work and see the trending of the major markets first.
The S&P 500 price crossed over the 50-day moving average thus trending it more bullish. Note that earlier in the week it was already trending short-term bullish as I had covered in the Stock Markets mid-week note. The price action since then has strengthened.
The Dow Jones looks the strongest and now the price has crossed over its 200-day moving average. Since Oct 12 it is up +12%.
The NASDAQ has turned short-term bullish with the 10-day moving average crossing over the 20-day moving average. This is good considering the Big Tech earnings this season has been mostly bad. I cover Big Tech every Tuesday mornings.
The NASDAQ 100 ticker QQQ is trending short-term bullish similar to the NASDAQ.
The Russell 2000 price crossed over its 50-day moving average. It is trending similar to the S&P 500 and keeping pace with it.
The Emerging Markets continue to trend perfectly bearish. This is a big divergence from the rest of the major markets.
The All-Country World Index price crossed over the 50-day moving average and it continues to trend short-term bullish.
Next, let us look at the week-by-week performance.
All are positive now 2 weeks in a row. We can see that the Dow Jones is the strongest as it is up 3 weeks in a row now. The NASDAQ and NASDAQ 100 gains were lower after being the leaders in the prior week. Good to see the Russell 2000 and the All-Country World Index eking out strong gains in the last 2 weeks. That indicates that the market strength is broad-based.
Here is the performance over different periods in time.
Good October for all except for the Emerging Markets. Amazing run for the Dow Jones and very strong for both the Russell 2000 and the S&P 500. The Dow Jones is now only down -10% for the whole year to date. In contrast, the NASDAQ is down almost -30%.
I trade the SPX and the QQQ on a regular basis, so I wanted to do a little more technical analysis on them.
Here is SPX 3-month chart.
With the big wick from Friday the S&P 500 has overcome the first resistance level of 3825. The next resistance level is at 3917 and price currently sits at 3901. So, that is a test. Note that with the huge up day on Friday the price has also crossed over the line I had drawn connecting the prior 2 short-term highs.
On the 1-year chart, we can draw a different line connecting the last 3 highs.
The line ends at around 4150 currently but with time it my go down to around 4100. That also happens to be another resistance line (one after the current one at 3917). So, everything is not clear, and the S&P 500 will need a lot of strength to overcome these levels. The first test will likely be next week when we will see if it can take out the 3917.
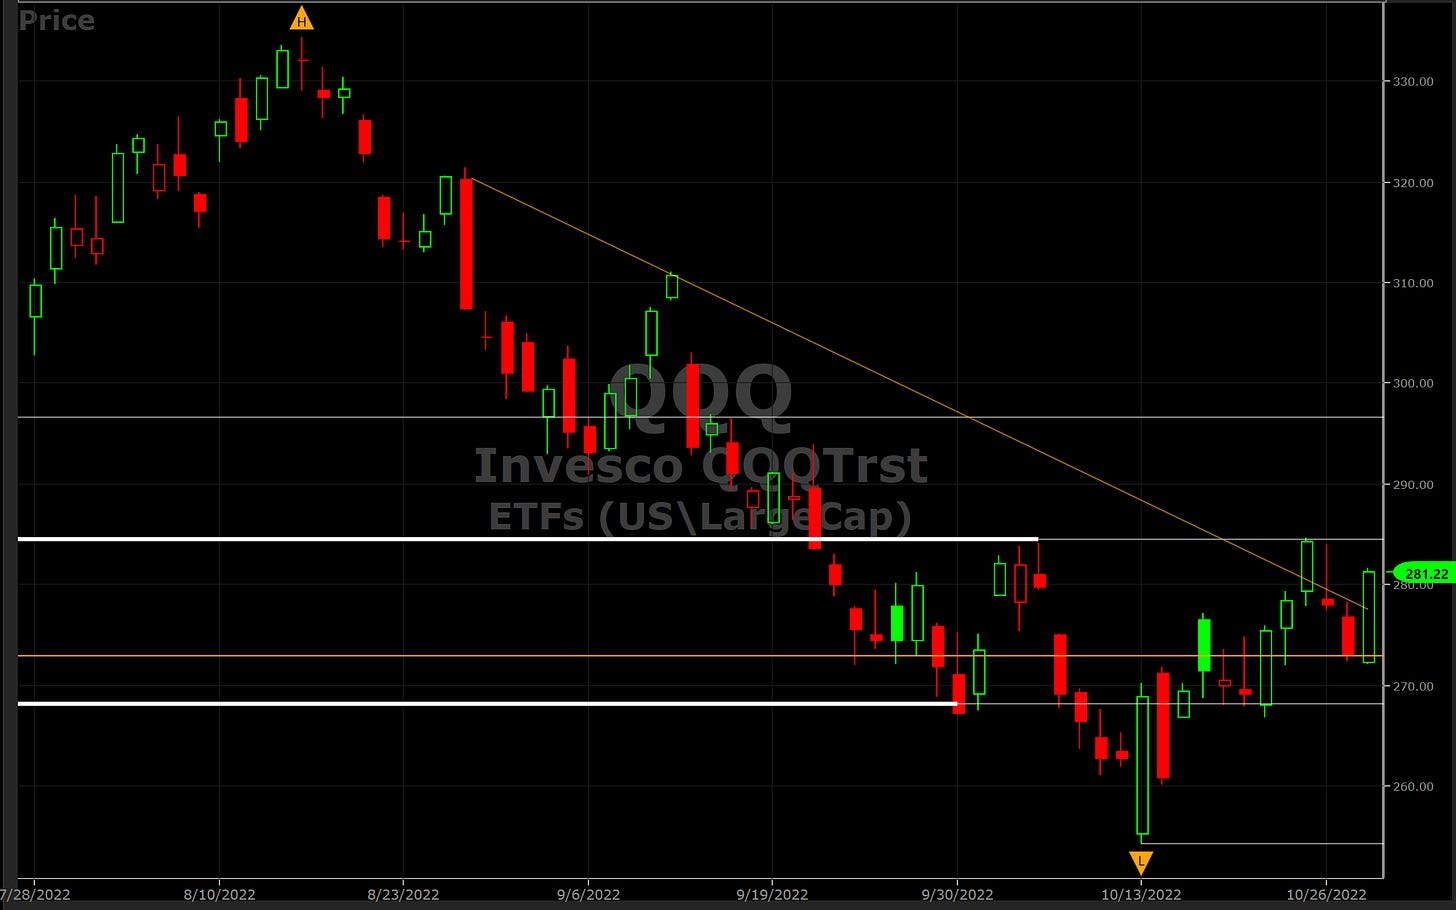
Looking at the QQQ 3-month chart.
The QQQ price is getting close to its resistance above from where it had reversed earlier. That resistance is at 284 just 3 points above where the price stands at now. So, that will be a big test for the QQQ as it had failed there the last time.
Conclusion:
The markets are up 2 weeks in a row and all of them are demonstrating bullish trending except the Emerging Markets which still needs to do some work.
The SPX and the QQQ does have resistance just above their current price. So, there could be (at the very least) some hesitation and indecision before it keeps going higher. The worst-case scenario is that they reverse from here. The best case I think is they keep moving higher but after some volatility. It seems to me that the volatility is unavoidable.


