


Week 4 Major Markets mostly Trending Bullish
Let’s review the trending heat map and the changes from my last review. Other than the S&P 500, the NASDAQ and India, every market is trending perfectly bullish. This could be the beginning of the overall reversal to the bullish side. Or we could again experience a mean reversion where markets give back some after such a big run so fast.

S&P 500 there is no change in trending. The price went up and it continues to trend short-term bullish. Just a little shy of being perfectly bullish.
The NASDAQ improved its trending with price crossing over the 200-day moving average. The trending is now at par with the S&P 500.
The Russell 2000 continues to trend perfectly bullish.
The India INDA price continues to fall off a cliff. No change in trending. It continues to trend poorly. Strange considering that according to experts India will have the best growth this year. Perhaps the market is already overvalued.
China FXI is now trending perfectly bullish.
Eurozone EZU continues to trend perfectly bullish.
Europe, Australia, Asia and Far East EFA continues to trend perfectly bullish.
Emerging Markets EEM turned perfectly bullish.
Dow Jones continues to trend perfectly bullish.
All-Country-World-Index ACWI continues to trend perfectly bullish.
Let us review the week-over-week returns of the markets.
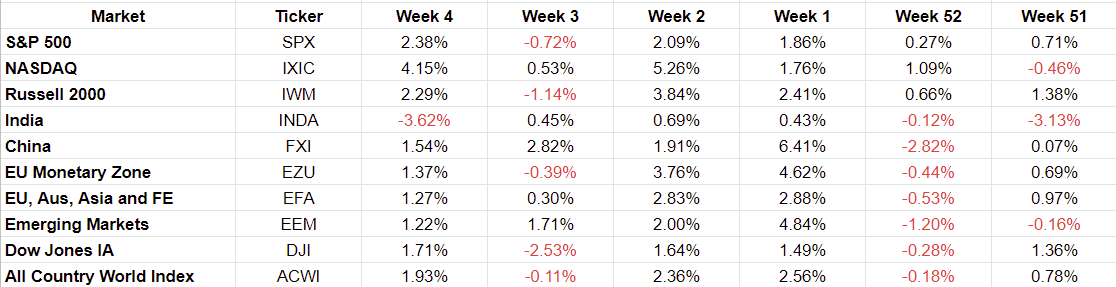
A very strong week for the markets except for INDA which we noted above. The S&P 500, the NASDAQ, the Russell 2000, China FXI, EFA and Emerging Markets EEM have all been up 5 out of the last 6 weeks. That is 6 out of 10 markets that have had a fantastic run.
Let us review the returns over various periods.

January has been a good month for all markets except India. Interesting to see double digit gains for the NASDAQ, China, Eurozone and Emerging Markets. With 2 days left in the month, this could be the solid start that everyone wanted.
So, the question now is where do we go from here? We know that markets do not go up in a straight line. With the momentum we have seen to the upside this month, there is every chance that markets will give back some now.
Much of what we do depends on our time frames. For investors, the trending is as good as it gets. So, they should stay put for now in the market. For traders the situation could be different.
Let us look at the S&P 500 chart to see where we stand.

The trending speaks for itself. We can see that price has decided to cross above the upper trendline in yellow. So, the break from the cone is certainly to the upside. We have the 3 green horizontal lines depicting the inverted head and shoulders. So, the upside breakout is not surprising. We can also see the 150-day moving average curling to the upside signaling the onset of a bearish to bullish reversal. Everything looks good.
The only thing to consider is whether the market is getting overbought. The price is at the upper end of the Bollinger Band (not shown in chart) and the RSI is at 70 (also not shown in the chart). These 2 could mean that the market will take a breather but could be a very small one.
So, in conclusion, I do expect a down day within the next few days. But the markets look like they are out of the downward channel we have seen them all of last year.