


Week 36 Major Markets Analysis
This is the current week trending heat map for the major markets:

This is how the trending heat map for the major markets looked like for last week.

We see the nice uptick with most of the markets moving over their 10-day moving average. All except the Emerging Markets. Some have also crossed over their 50-day moving average.
The week’s returns below provide the reason why we see the green shoots in the trending heat map.
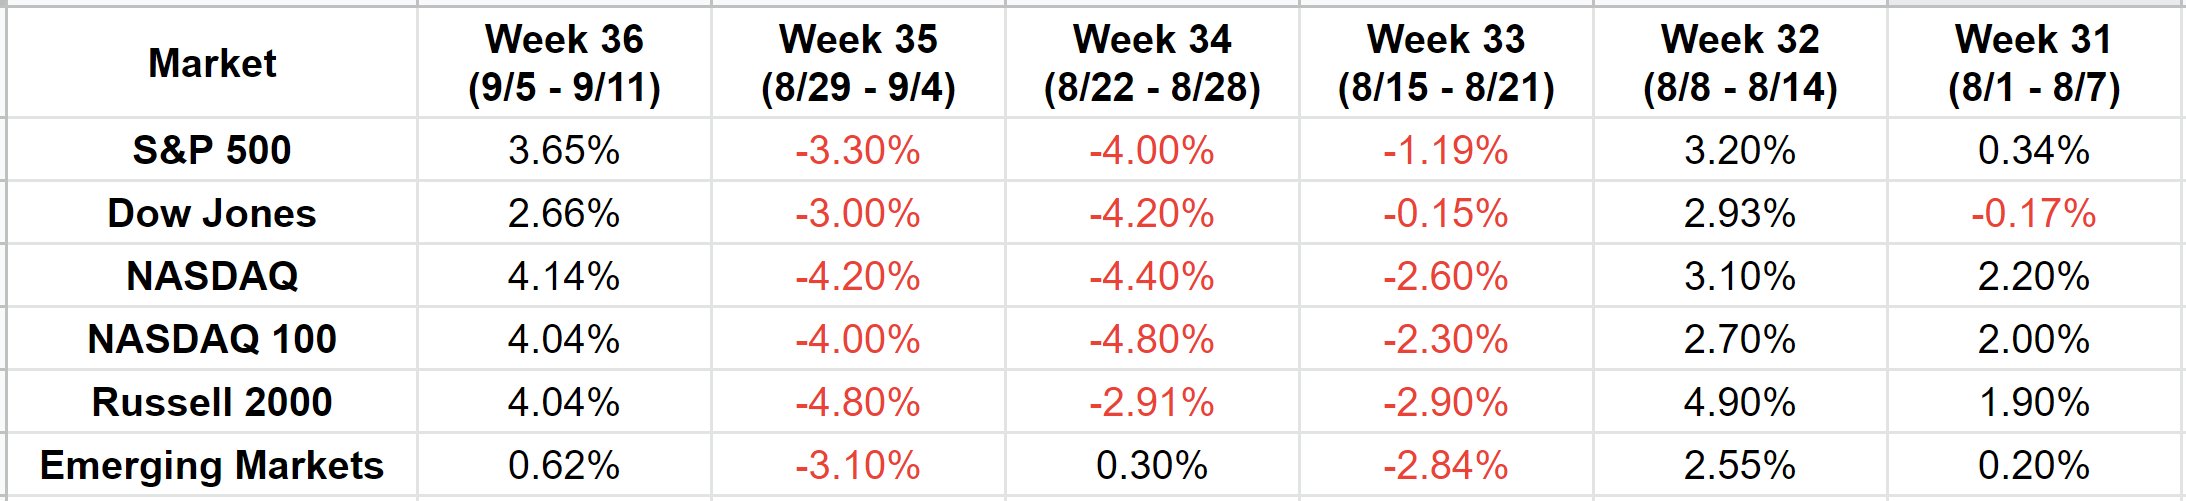
After 3 weeks of losses, we have a strong positive week. I still do not consider this as a trend reversal. We need to see follow-through next week.
Here is the S&P 500 chart for 6 months with my support and resistance lines plotted on it.
We can see that the last candle moved the price over a resistance line. But there is another resistance line just above. Also, between the last 2 candles there is a gap and gaps usually have a way of filling up. So, I will not be surprised if the price falls against the overhead resistance and tests the line below which now is support.
Here is the 6-month NASDAQ chart.
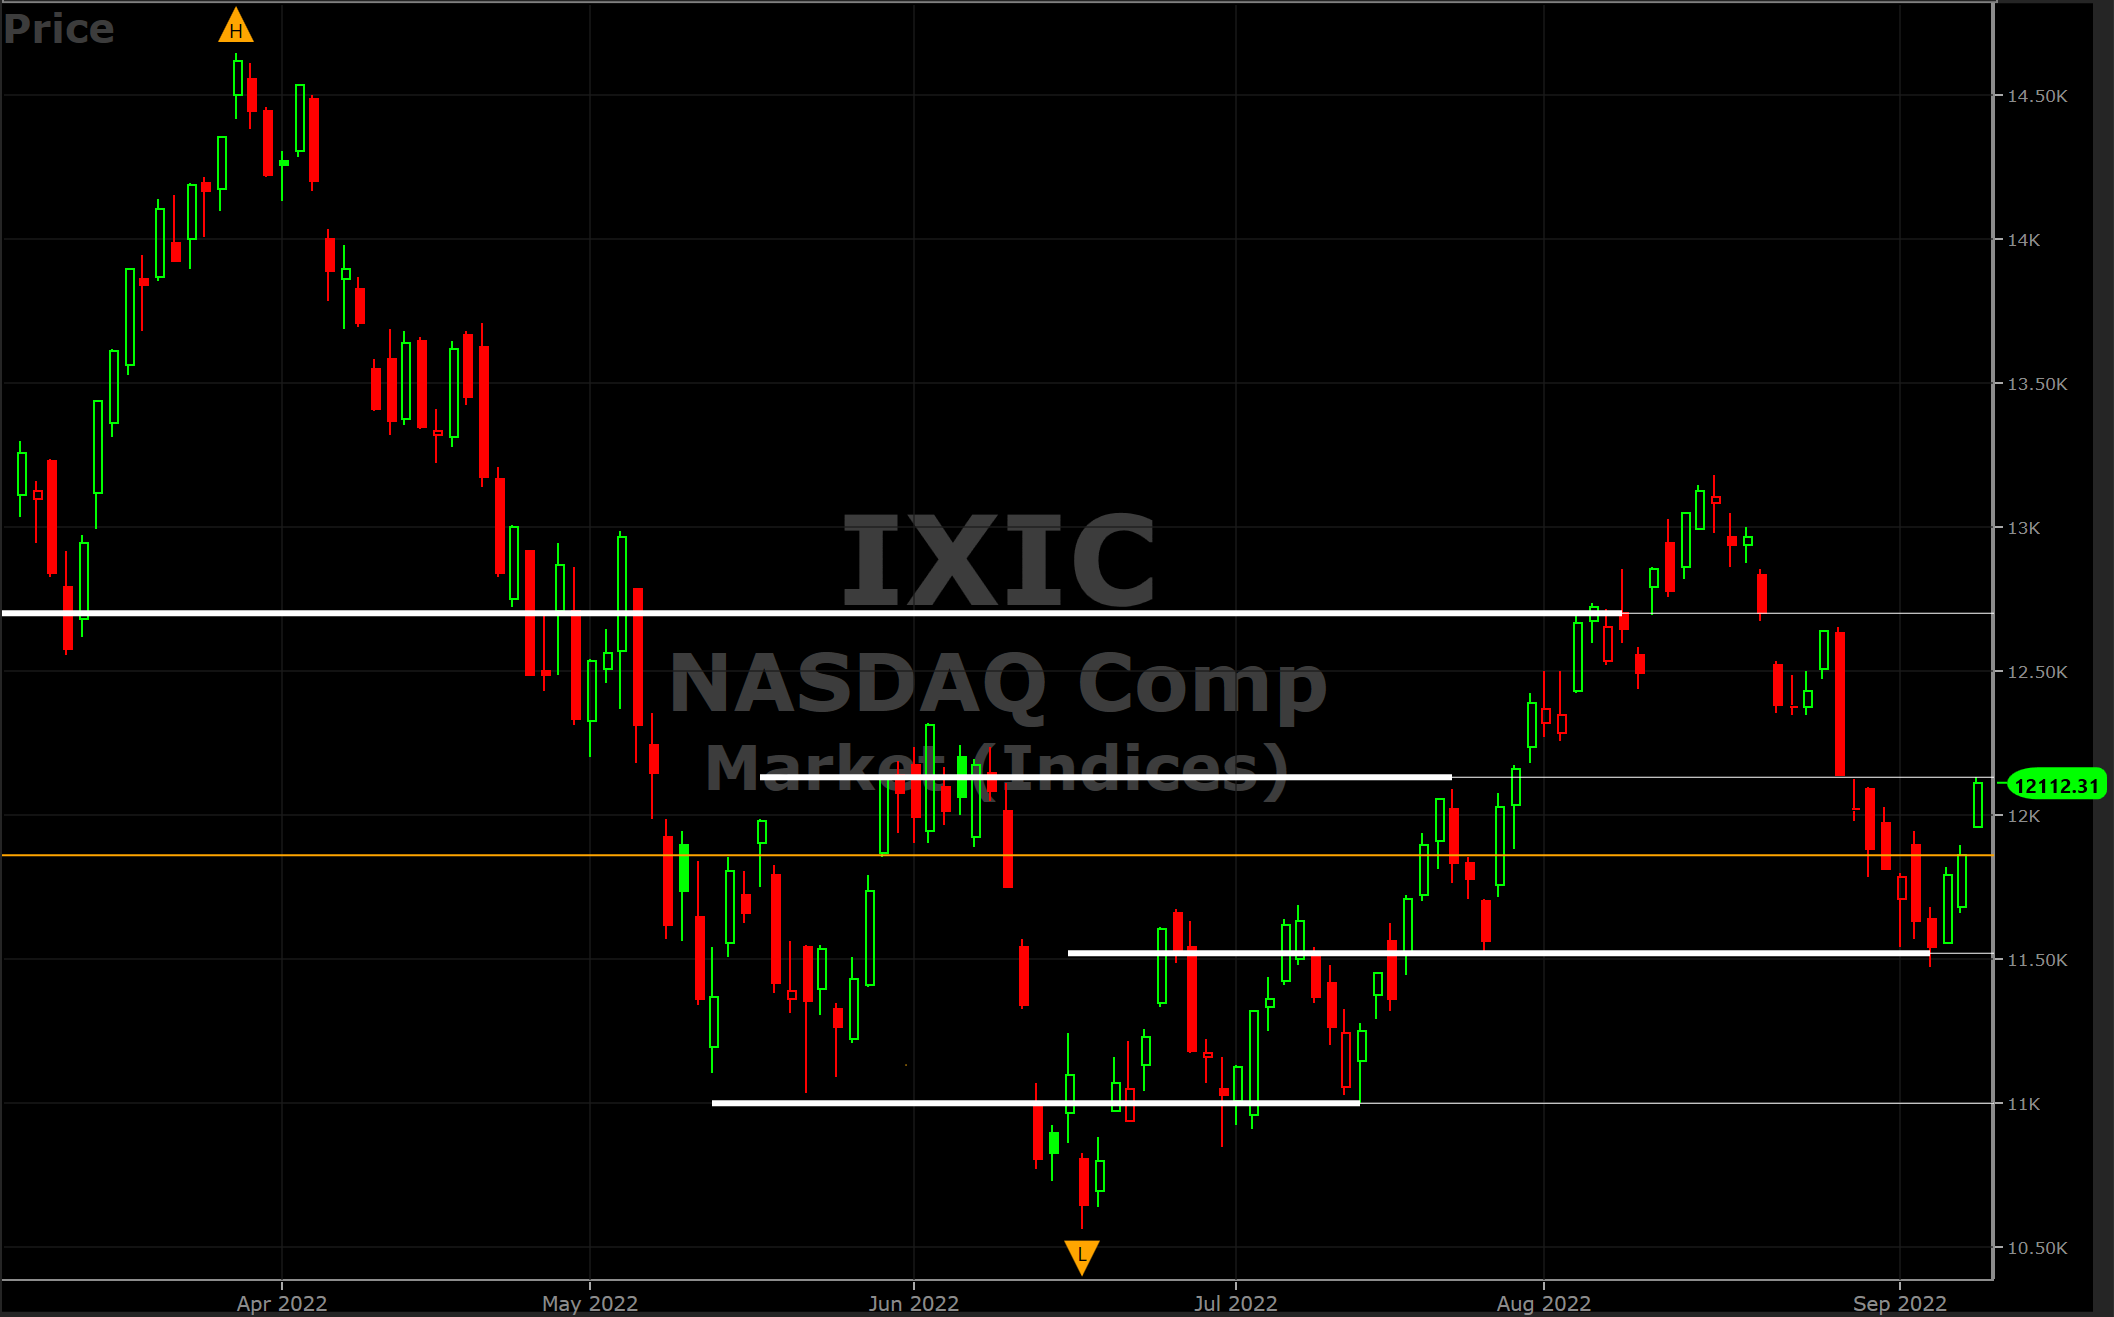
We can see the price movement is similar. In fact, the price just stopped at overhead resistance.
So, for Monday, I expect some indecision in the trading. There is a good probability that the markets do not end the way it starts. Meaning, if it starts higher, it closes lower and vice versa.
For the whole week, I consider it an even situation. The markets are trending short-term bearish. At the same time this week could be the beginning of a reversal. So, right now, I do not have a directional bias.