

Week 28 Monday Post-Market Chart Observations
All major markets closed up today. Strangely the VIX was also up.

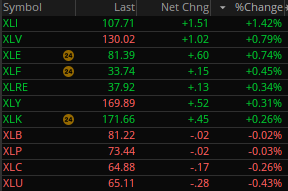
Most of the SPX sectors were also up.
Looking at the charts for trends and any changes to trends.
SPY: Price remains above the 10-day and the 20-day moving averages. The 10-day also remains above the 20-day moving average. So, we continue to trend short-term bullish. The MACD histogram is increasing below the 0 line though indicating a divergence.
QQQ: Price remains above the 10-day and the 20-day moving averages. The 10-day also remains above the 20day moving average. The MACD histogram continues to get more negative though. Today is the 3rd day in a row it has decreased, and it has been negative for the last 12 trading days. So, kind of mixed trend. Price has been in a channel of 357 - 373 over the last month.
IWM: Price moved up big today and has just breached the 188 level. This is the 6th time over the last month that price has tried to take out that level in a meaningful way. It has failed the last 5 times. We are going to have a golden cross (50-day moving average of price crossing over the 200-day moving average of price) tomorrow and potentially the 10-day moving average also crossing over the 20-day moving average tomorrow. That could take the price over the hill as well. MACD histogram is negative but improving.
XLI: Price hit a new 1-year high and currently sits at a prior high which has been resistance since Jan 2022. Price most definitely wants to go higher and I think this could be a good long play.
XLF: Price has turned short-term bullish with the 10-day moving average crossing over the 20-day moving average. Price also went over the 200-day moving average in another show of strength. The recent high is 34 and it can be a good long play if price can close above that.
XLV: The trending has turned short-term bearish even though it was a big up day today. The MACD histogram is also negative. This can be a short play.
XLE: The price trending turned short-term bullish today with the 10-day moving average crossing over the 20-day moving average. The MACD histogram is also positive and increasing. This can be a good long play.
IYR: Price is trending short-term bullish. The MACD histogram is also positive but decreased a bit over the last 2 days. The recent high close was 88.08 and this could be a good long play if price can close above that in the near future.
EWZ: Price trending turned short-term bearish. The MACD histogram is also negative. This can be a short play.