


Week 25 Top ETFs Review
Most of the ETFs demonstrated weakness last week even though they continue to trend bullish per my model. The MACD readings indicate bearish behavior and I have accordingly played some of these to the downside. Next week will tell us whether this downtrend was the beginning of a sustained pullback or the markets just taking a breather.
The thinking that the broader markets were starting to participate in the bull run by the big tech was somewhat negated last week. Both the RSP and the IWM gave back more than the SPY and QQQ.
Trending Heat Map (SPX Sector ETFs)

I covered the major markets yesterday for the same period and saw the weakness developing. The SPX sectors are confirming this weakness through the above picture. Note that the highlights are the changes from prior week.
We cannot jump to the conclusion that given the weakness this week, the markets will continue to weaken and turn bearish immediately. In fact, per the above picture, all the sectors are still trending short-term bullish. At the same time, we know that markets trend through cycles. So, there is a good chance that we turn bearish at some point. But that could still take some time. Note that the VIX us still at 13.44 which is very low indicating stable markets.
MACD Review (Expanded list of ETFs)
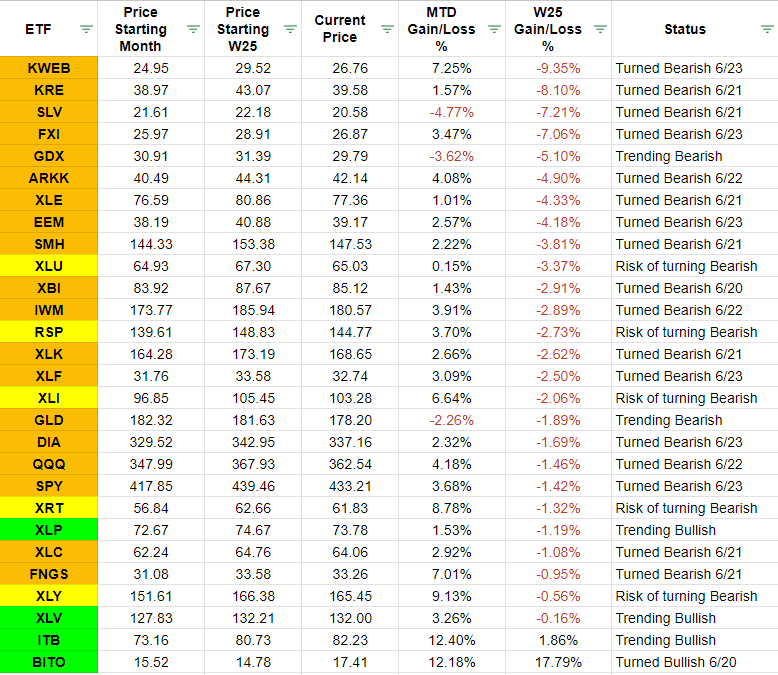
Last week was universally weak with only 2 out of the 28 ETFs that I track being positive. The color coding also tells us the story. Except for the precious metals sector though, all the others are positive so far for the month. So, next week will be interesting to see what direction we are headed.