Week 24 SPX Sectors Trending and Performance
It is an all-round bullish environment for all the SPX sectors keeping in sync with the major markets. There is much more participation now with 6 of the 11 sectors trending perfectly bullish. Among them the XLY, XLK and XLC remain the primary leaders and are now joined by the XLV, XLI and XLB. The XLE and XLF are the laggards.
Looking at the charts for short-term trades, here are the quick observations:
Bullish and can go higher (7): XLV, XLU, XLP, XLRE, XLI, XLF, XLB
Bullish but at risk of reversal (4): XLY, XLK, XLC, XLE
Looking at the above, one may think that S&P 500 should go higher as I list 7 of the 11 as likely to go higher. However, the sectors are not equal weight. The XLK, XLC and XLY have a disproportionate weight. So, it is really a toss-up.
Trending Heat Map
All-around improvements in the trending can be seen from prior week. The XLV and XLB turned perfectly bullish. Now we have 6 of the 11 sectors trending perfectly bullish. And out of the other 5 sectors, only XLE and XLF did not improve upon their trending.
Performance
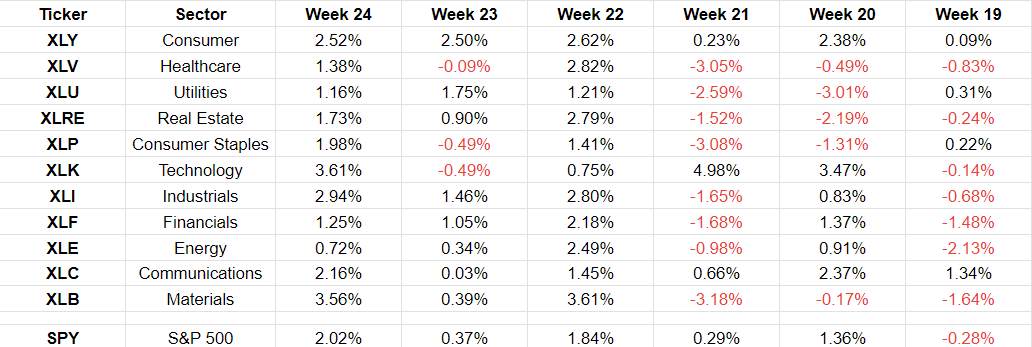
As we saw in the major markets analysis, all the S&P 500 sectors are also having a fantastic June. The XLY, XLI and XLB have been the leaders in June while the XLY, XLK and XLC are the obvious winners looking at all of 2023 so far.
Week-over-Week Performance
We can see that the XLE and XLF are the laggards. But more importantly and perhaps somewhat surprisingly, XLY has been positive 6 weeks in a row (it is actually up 8 weeks in a row). Who says the consumer is weak. We should remember here that AMZN and TSLA are part of XLY.
Chart Observations
(The notes around chart observations are geared to indicate short-term trades. They are at a more granular level than the trending heat map above. The objective is to find trading opportunities for the next few days to the next few weeks.)
XLY: The MACD histogram has reduced now for the last 3 trading days. The MACD line is still well above the signal line and no crossover is going to happen in the next couple of days. This could be turning bearish, but we have to wait and see.
XLV: Price turned bullish recently and now sitting on the 150-day moving average. It can keep going higher by at least another 1.8%.
XLU: Price is trending bullish and can be traded for an upside to 68.6 which is +2% from current level. Then it hits resistance and, if it can break through that, can go higher.
XLRE: Price remains bullish for now.
XLP: Price just turned bullish and can keep going higher.
XLK: Price came close to its all-time high and then closed lower. The last candlestick is a large red one with price closing at its low. That was a reversal of price that had closed above the Bollinger band the prior day. The MACD histogram also reduced. So, this could be the beginning of a reversal or just the price taking a breather. The next couple of trading days will give some indication.
XLI: Looks strongly bullish.
XLF: Price is bullish.
XLE: Price is trending bullish but is at risk of reversing.
XLC: Price was down last trading day after being up for 6 straight days prior to that. So, it could just be a breather or the beginning of a downturn. We are several days away from knowing if it is a downturn though. So, for now it remains bullish.
XLB: Price is trending bullish and looks like can go higher.


