


Week 22 Major Markets and Sectors Trending
Everything was green between yesterday and today’s trading. Markets have finally decided they want to go up and the S&P 500 was able to break out of its range of 4100-4200 closing at 4281. More importantly, the broader market as reflected by the IWM took off and turned short-term bullish. It was up _3.6% just today and closed at the high.
This is indeed a massive move up and I am inclined to believe this run can continue for some time. I covered my short positions with losses and re-learned that the market can be irrational longer than I can stay solvent. Thankfully, my positions were small positions, and I was able to get out without a big dent to my portfolio.
Major Markets Trending Heat Map

The changes reflect just the last 2 trading days. The picture reflects the overall trending and the fact that all markets seem to be participating. I wanted to see the impact of this week on the other sectors as well. So, I will only cover the trending heat maps today.
SPX Sectors Trending Heat Map
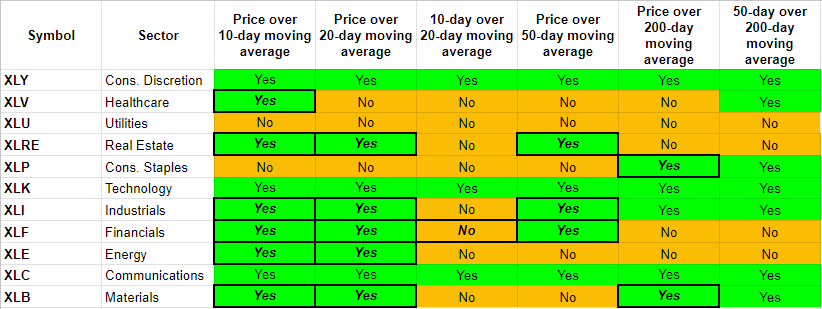
The changes reflect all of this week which was 4 trading days. The picture clearly looks a lot greener and confirms that the broader market participated in the last 2 day’s price moves.
Thematic Sectors
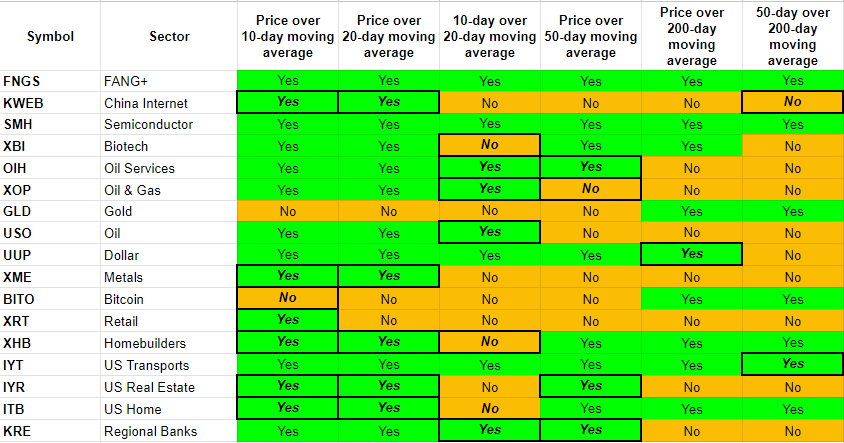
A similar picture here. We are in a broad-based bull market. Well, not so fast. The S&P 500 chart below shows that we are very close to a 1-year high which is at 4305 reached on August 2022. (See below for the 18-month chart).

Then, there is the all-time high of 4818 reached on January 2022. We did break through the 4100-4200 range in a meaningful way through and that is something. This is despite all the negativity surrounding the markets. Let’s see if we can continue with this upswing.
Have a good weekend.