Week 19 Mid-Week Market Notes
We have an interesting situation with the major US indices. The S&P 500 and the NASDAQ are trending bullish whereas the Russell 2000 and the Dow Jones (to some extent) are trending bearish. When we have this kind of divergence it is safe to say that the overall market is trying to make up its mind what it wants to do. So, it is in a sideways phase.
S&P 500
The big thing that happened today as far as I am concerned is that the S&P 500 went short-term bullish. Here is the simple YTD chart:
The price movement still looks undecided and mostly sideways for the year as we can see above. However, the price is well above the 50-day and the 200-day moving averages. The 50-day is also well above the 200-day moving average. So, we do not have the risk of that trending changing anytime soon.
The short-term has been bouncing back and forth quite a bit with the last short-term bearish trending just lasting 5 trading days. The question mark though is volume. It was very low today compared to the daily average. So, it is difficult to make too much out of this reversal. I guess the next 2 days of trading will define whether this is a true trending reversal or a head fake.
Here is a different view of a 1-year chart with 3 horizontal lines showing the band within which the price is trading. The trendline is the 150-day moving average.
The 150-day moving average is curling somewhat hesitantly from a bearish trending to a bullish trending. However, the price movement around it is not a bottoming trend. So, I cannot really say we are off to the races at this point. Will need to see what the next 2 trading days this week does to the price.
NASDAQ
The NASDAQ had turned bullish yesterday and it actually made a new YTD high today. Here is the YTD chart:
The volume today was lower than average just as we saw for the S&P 500. However, with price making a 2023 high today, there is no denying it’s strength.
Russell 2000
The price is trying to make a comeback, but the trending remains bearish on all accounts. Here is the YTD chart:
We still have a death cross (50-day moving average cross below the 200-day moving average) which will take some work to overcome. And, we also have the 10-day dip below the 20-day indicating short-term bearish trending.
Dow Jones
The Dow Jones is trending short-term bearish. Here is the YTD chart:
The good thing for the Dow Jones is that, as opposed to the Russell 2000, it is trending long-term bullish like the S&P 500 and the NASDAQ.
SPX Sectors
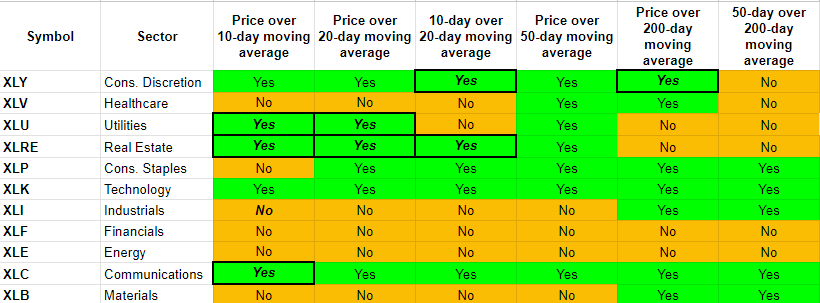
Here is the updated trending heat map:
The changes are all on the bullish side. The XLY, XLU, XLRE and XLC showed strong improvement. So, right now here is the scorecard:
Perfectly Bullish (2): XLK, XLC
Short-Term Bullish (3): XLY, XLRE, XLP
Perfectly Bearish (2): XLF, XLE
Short-Term Bearish (4): XLV, XLU, XLI, XLB
The XLY seems to have had a breakout. See this 1-year chart:
Other ETFs I am watching/trading:
GLD and GDX not trading well over the last few days but have turned back to trending bullish. SLV is weaker so have to decide next actions.
XBI (Biotech) remains bullish and price movement is strong. I traded it the last couple of days and will go long again at the right time.
EWW (Mexico) also there is no stopping it.
BOTZ just turned perfectly bullish, and price touched a new YTD high.
URA turned short-term bullish and price has jumped.
IYR just turned short-term bullish.
Happy trading.


