


Week 19 Commodities Trending and Performance
Precious metals have been challenged over the last couple of weeks. My trades have lost some money although they still have time to recover. The question really is whether the upside potential for precious metals has diminished or was that just a breather it was taking. Hopefully some answers will emerge in today’s analysis.
Trending Heat Map
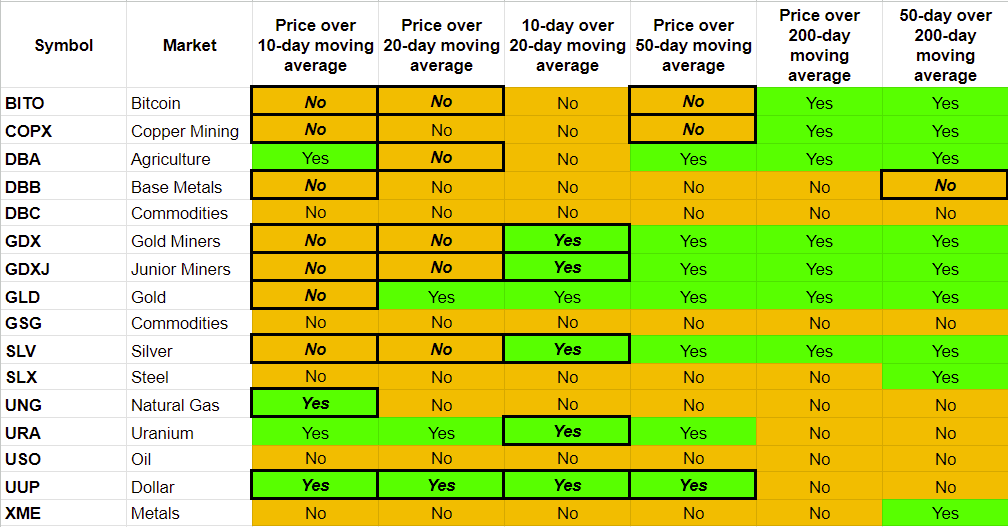
A lot of trending changes over 1 week for the commodities that I track. I can see that the US Dollar is trending short-term bullish while the precious metals have been struggling to some extent. However, the trending of the precious metals is not yet bearish so far. It does seem it is headed that way though. And maybe that is because of the strong dollar.
It is good to review the asset correlations of some of the assets to get a better perspective. I use Portfolio Visualizer for this.
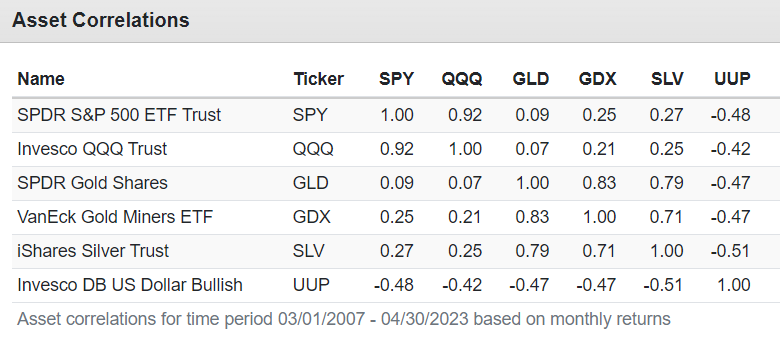
We can see that the GLD to SPY correlation is only 0.09 which indicates very low correlation. Similarly, between GLD and QQQ the correlation is only 0.07 which is even lower.
But the more important observation is that the correlation between the UUP (US Dollar) and GLD is -0.47 which is an inverse correlation. So, it makes sense that if the dollar goes up, gold will go down and vice versa. The US Dollar is trending short-term bullish right now. So, I do not feel comfortable holding on to my GLD, GDX and SLV long positions.
But let us not make a hasty decision before we see the performance numbers and also review the charts.
Performance

So, other than SLV, the precious metals are doing OK for May so far. Silver is really bad, and I should definitely offload.
Bitcoin, Metals, Natural Gas and Oil are all bad. Dollar did move higher in May so far. Note that +0.75% within 2 weeks is actually quite a big move for the currency. If this trend continues, I should definitely offload all my precious metal positions.
GLD chart

The price is extended well above the 150-day moving average which is a little worrying. But price is also trying to break out of a 3-year level, and this will be the 2nd attempt at that. There are a few gaps below that will need to be filled at some point. But as of now that is not in danger.
I will need to observe whether the price holds up or gives up from this level. If it gives up, I will close my long position to play another day.
GDX chart

The price has checked back to a congested level that acts as a support level for now. There is still a gap above that needs to be filled at some point. And I am aware that there is a small gap below that also needs to be filled at some point.
There is a good chance that the price reverses back up from here (at least temporarily). So, I am going to play for that and hold my long position for now.
SLV chart

This one is a little more in danger. The price seems to want to touch back to the 150-day moving average. We are currently hovering around an important support level. If price can hold this level, then we may still be fine. Note that there is a largish gap created by the price action of the last 3 trading days.
The risk seems to be more to downside at this time. So, I will take a proper opportunity to close my long position.