

Week 18 Major Markets Trending and Performance
There was more volatility in the markets than the VIX handle of around 17 would indicate. The first 4 days of the trading week, the S&P 500 was down -2.6%. Then last day of the trading week (today) is gained back +1.85% to ultimately be down only -0.79% for the week.
While the bulls can say that was a great comeback, the bears can say that was a very orderly decline. I cannot figure out catalyst(s) for the market to go up. If, as the markets are indicating, the Fed will start cutting rates as early as July, it will likely be because something bad has happened to the economy. So, to feel bullish because Fed will cut rates is misguided in my opinion.
But opinions don’t count. Only price does. So, let us get on to look at price and its trending.
Trending Heat Map
The NASDAQ 100 actually turned back to perfectly bullish. And, after all the ground it gave up the first 4 trading days, it closed the week back almost exactly where it started in the week. The Russell 2000 and the Dow Jones also improved on their trending although they continue to trend bearish overall.
Performance
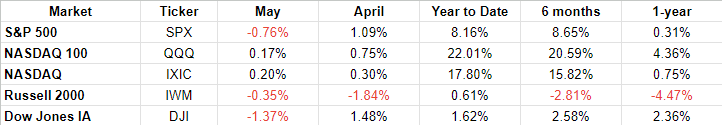
It is clear to see the outperformance of the NASDAQ (and NASDAQ 100) in comparison to the Russell 2000 and the Dow Jones. The stark contrast is best seen in the year-to-date performance numbers.
This just tells me that there is unfinished business between the bulls and the bears. Either the bulls are going to bring the rest of the market up to closer to the performance levels of the NASDAQ markets, or the bears are going to bring the NASDAQ markets down. Something has to give.
I do not make predictions as to what will happen. I just trade based on the price movements and trends. As of now, I am positioned short the IWM, SPY and the QQQ. Given that the QQQ turned back to trending perfectly bullish today, I will revisit my position again early next week and see how things shape up. I am OK with SPY and IWM as of now as they are still trending bearish.