


Week 15 Commodities Trending and Performance
I track about 85 ETFs that cover the domestic and global equity markets, specific sectors, commodities and also several alternate sectors. This gives me good diversification and helps me find long and short opportunities while keeping a close eye on a finite number of instruments. I track some large cap stocks but very rarely trade them.
Over the last couple of months, I have been trading the precious metals and their related instruments. This has been very profitable for me, and I intend to continue with this until things change.
Summary
Precious metals have been on a run, and they continue to trend well. I hold long positions and will continue to trade them. They have moved up quite a bit in a very short time frame. So, there is a risk it gives back some of the gains before pulling ahead again.
I will also look at Copper Mining COPX as that seems to be breaking out. Oil may be moving up as well. Natural Gas continues to be in the doldrums.
Trending Heat Map

Very nice-looking picture. Natural Gas and the US Dollar continues to trend bearish. Other than that, everything mostly looks good. I have profited from trades in GLD, GDX, GDXJ and SLV. I also hold GDXU (as of now) in my retirement account. I continue to hold GLD, GDX and SLV calls in my trading account.
Performance

We can see that commodities have delivered real returns, and this is not just Bitcoin. I have benefited from the move in the precious metals. (Note that I hold Bitcoin as crypto). But we can see that Copper Mining COPX has done well as well. Here is the performance month-by-month.

While I will continue to trade the precious metals, I will be taking a deeper look at COPX as well.
GLD Chart

The chart looks scary good but note that it has touched a 52-week high. The 150-day moving average is clearly turning bullish. The price is way above the 150-day, so price may move down or sideways for a bit for that to catch up. No reason to change my stance though. So, I will continue with my long trades.
GDX Chart

That move is scary good. It did close one unfilled gap and could now go after the other one. There is a small gap below and also the price is way above the 150-day moving average. So, those are concerns. But until the trend reverses, I will continue to play the trend.
SLV Chart
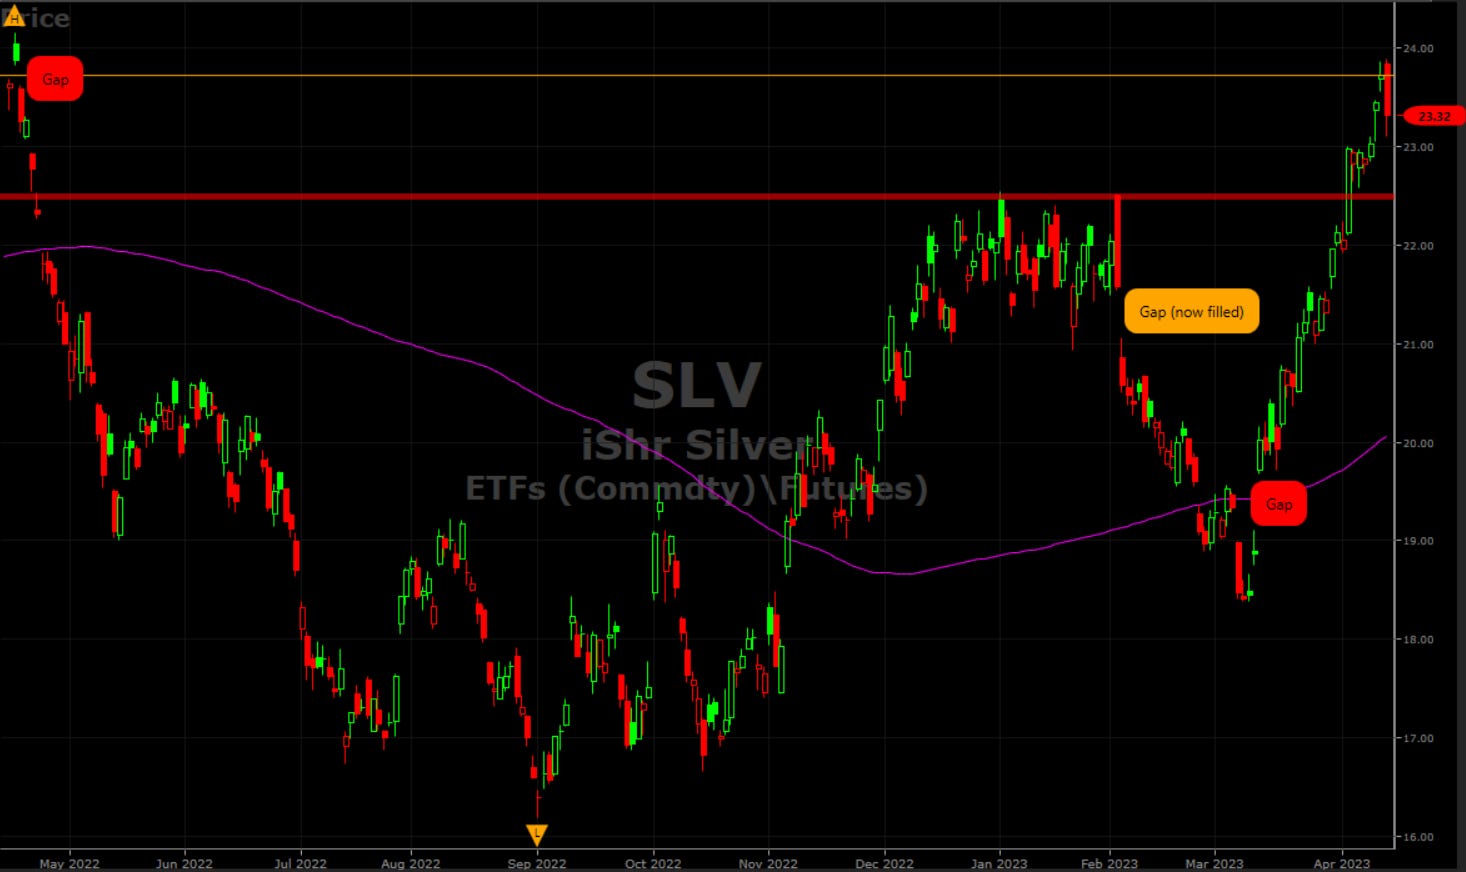
This looks very similar to the GDX. It is scary good, but the trend is intact. So, I will continue to play to the upside.
COPX Chart

I will wait to see where the price goes from here. It can breakout through what looks like a resistance line, or it could go down and fill that gap first. This is in the close watch category for me.
USO Chart

I am worried about the big gap below. There also seems to be some resistance above. So, I think this one has high risk as of now.