


Week 14 Technology Sector Trending and Performance
I have started deeper assessments of some sectors that are likely driving markets. Technology is one of the biggest ones. I use the ETFs that I track closely and also list out the biggest tech names to get some perspective.
Trending Heat Map (ETFs)

The picture looks very green which (in my opinion) is not necessarily a good sign for the immediate near future. We know that the broader market is weak based on what we saw in the Russell 2000. Semiconductor SMH could be the first shoe to drop given its price has dipped below its 10-day moving average. It is one of the first big ones to do that.
I track Consumer Discretionary XLY in here because the 2 biggest stocks in that are Amazon AMZN and Tesla TSLA. Yes, strange but true.
Trending Heat Map (Big Tech)

Well, what can we say: Tesla is the worst trending of the big tech stocks. Block (SQ) is not far behind. But again, the trending is mostly green. How long can it stay green. I guess we will know.
Performance (ETFs)

With all the talk of the mega big tech stocks it may come as a surprise to see the returns of BITQ this year. Here are the top 10 holdings in BITQ:
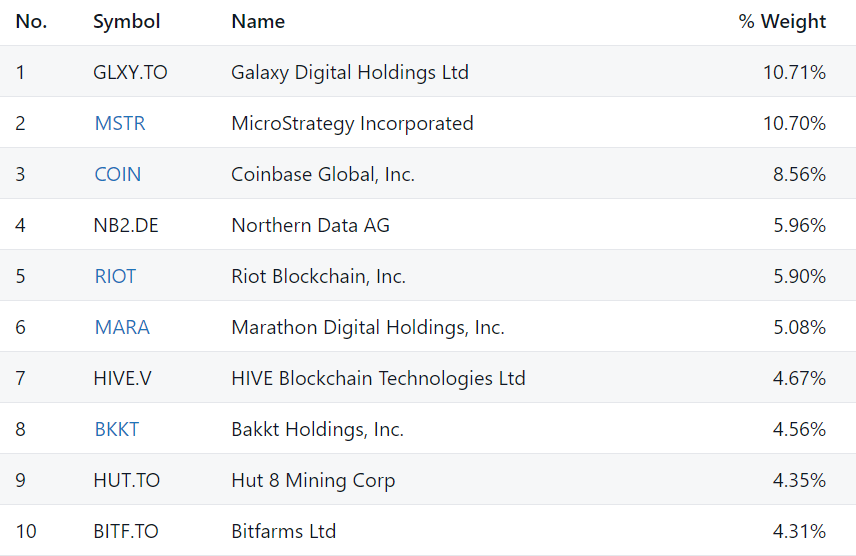
Of course, over 1 year it is also the biggest loser.
Performance (Big Tech)

Nvidia has been the story of the year. It is also one of the only 2 stocks that is positive over 1 year. Over 2023 all the stocks have returned gains as of now. In fact, most have generated double digit gains.
I am a bit skeptical whether the gains so far this year can be sustained going forward. Certainly, if we end the year now and these are the results, I would imagine most people holding these ETFs or stocks will be happy. But we still have 38 weeks to go in this year and I would not assume what we have seen in the first 14 weeks will be the same as what we will see in the next 38. That is the reason the markets are so interesting.