


Week 14 SPX Sectors Trending and Performance
We saw that the major markets were mostly flat for the week. Let us check if there was anything significant that happened within the SPX sectors.
Trending Heat Map

XLY price dipped below its 10-day, 50-day and 200-day moving averages.
XLV price crossed over its 50-day and 200-day moving averages.
XLU turned short-term bullish, and price crossed over its 200-day moving average.
XLRE turned short-term bullish. (I am short - will re-evaluate).
XLP no change.
XLK no change.
XLI price dipped below its 10-day, 20-day and 50-day moving averages.
XLF turned short-term bullish.
XLE turned perfectly bullish. (I am long).
XLC no change.
XLB turned short-term bullish.
Net situation: Trending improved for 6 sectors, worsened for 2 sectors and remained the same for 3 sectors. That is quite impressive (and surprising to me) given that the markets did not do much this week.
Performance

Given that the trending for 6 of 11 sectors improved for the week and only worsened for 2 of them, I am surprised to see that 5 sectors incurred losses over the trailing month.
Week-over-Week Performance
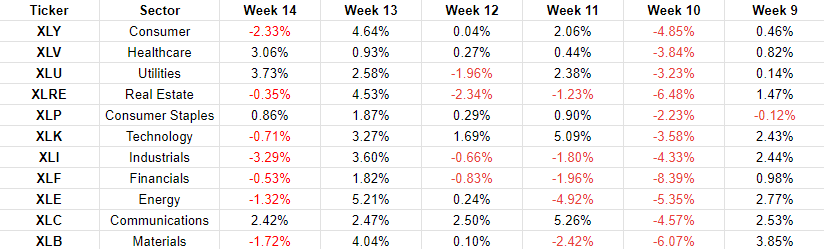
This is more of a surprise that 7 of 11 sectors had losses for last week and yet only 2 of them had their trending worsen. This could be a bit of “tail wagging” where prices are actually going down but because I use moving averages to measure trends, the trend actually improves.
This is the reason I look at the trending and also the actual performance. This current situation tells me there is more negative energy in the markets than positive. So, I feel good being positioned to the short side for now.