


Week 13 Major Markets Trending and Performance
The end of week 13 also marked the end of the quarter and markets are mostly trending bullish. In fact, 7 of the 11 major markets I track are trending perfectly bullish. Although, watching the experts on TV, there seems to be more fear in the markets than any greed.
Looking at the trending and the performance would tell us that markets should keep going higher. I do not make predictions but will take a deeper look at some of the charts as well in the note today.
Trending Heat Map

Decidedly green color overall for most markets. The Russell 2000 and India are also trying to catch-up with the others.
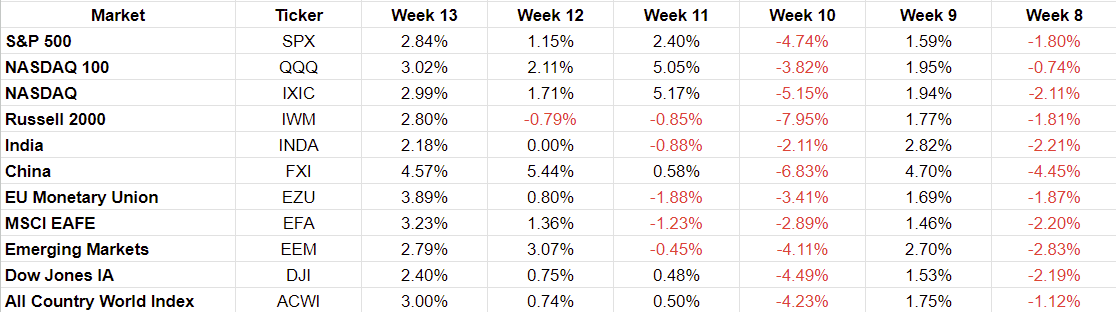
Performance

The Russell 2000 has had 2 bad months in a row now. So, is it time for it to catch up? The trending is getting better, so it is quite possible. Most other markets have had 2 good months out of 3 this year (except India which is strange as it is supposed to have the best overall growth this year).
I heard somewhere that April is usually an up month for the markets. If that happens, then we will break the cycle of (up, down, up) that we have had so far. Note that most experts on TV are saying markets are heated up and it is time for reality to sink in. There is a strong expectation that earnings calls will not go well this cycle which is in about 2 weeks starting with the big banks.
Week-over-Week Performance
A strong showing by all the markets this week, and in fact, 2 weeks in a row. Actually, the S&P 500, NASDAQ, NASDAQ 100, China, Dow Jones and the All-Country-World-Index are all up 3 weeks in a row. That is indeed something.
Thinking probabilistically, in any given week there is always a 50% chance that the markets will be up. However, past performance does have a bearing on future performance for the markets as it is not the same as a coin toss. The markets are driven by traders and investors who have emotions such as fear and greed. And, watching experts on TV, some fear seems to be setting in. All this to say, I would put the probability of markets going lower next week at more than 50%.
Now let us review some charts.
SPX

Those are the best lines I can draw. Price seems to be hitting up against that overhead line. There are a bunch of resistance/support lines around the price as well (not shown here). The RSI is at 70 and the Bollinger Bands show price is touching the high line. So, there is higher probability of price going lower.
NASDAQ 100

It seems like there is more room for price to go up. The only thing against the price movement is that it has gone up too fast too much. However, that is neither here nor there. Price has no barrier to go up further. It may dip a bit but until the trend changes there is higher probability of it going higher.
NASDAQ

Very similar to NASDAQ 100. However, there is some overhead resistance the price is coming up against. Resistance is meant to be broken and so the question is whether this is the moment price breaks through it. Looking at the price overshoot there is higher probability for a dip coming soon.
Russell 2000 (IWM)

The price has been week although it did close above its overhead resistance. There is a price gap above that the market may want to fill and then the overhead resistance levels look weak. So, price can keep going up. I would say the probability is 50%.
My Positioning
I am currently positioned mostly to the short side. This is a position in which I have taken some losses but do think that there is a higher probability I make up some ground next week. Beyond next week it is too hard to tell how things will look like.