

The S&P and the Sectors
The S&P 500 has been hovering between the 4540 - 4590 range for the last 9 trading days. This is after the big move up from around the 4100 level to the 4500 level. This was close to a +10% move within a month.
The question in everyone’s mind is whether it consolidates here before pushing past the 4600 mark OR does it first give back some ground in the short-term. From my trending analysis, it looks like it will give back some ground first. But the indicators have yet to confirm this.
So, I am in this intermediate waiting state to actually see what happens. The VIX is very low, and I expect that it can only go up. That would mean lower prices. But it is also a slow month and the VIX can just keep meandering around the 12-14 level for the rest of the month.
Here is how the individual SPX sectors trending looks like:
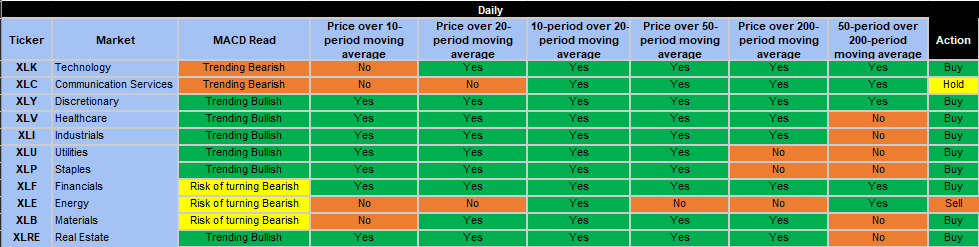
The above is based on daily charts. As we see, everything looks mostly green. The only one trending bearish is XLE because of the fall in oil prices of late. But remember, markets go around in cycles. One way to look at the trending heat map is that everything is bullish, so go long. The other way is that the markets are trending bullish and ready for a reversal.
Here is the trending heat map using weekly charts:

Again, the picture looks very good.
The challenge with trending is that we also got to look at how we got to the current trending. The history so to speak. Certainly +10% for SPX over 1 month is a very steep move. A move that had very few down days. The RSI also indicates overbought levels and as mentioned above, the VIX is at around its lowest levels in more than 3 years.
Strategy
Under the above conditions, I am cautious and watching the indicators to see if market starts a pullback. If it does, I will play some short trades.