Stock Markets: still waiting and watching
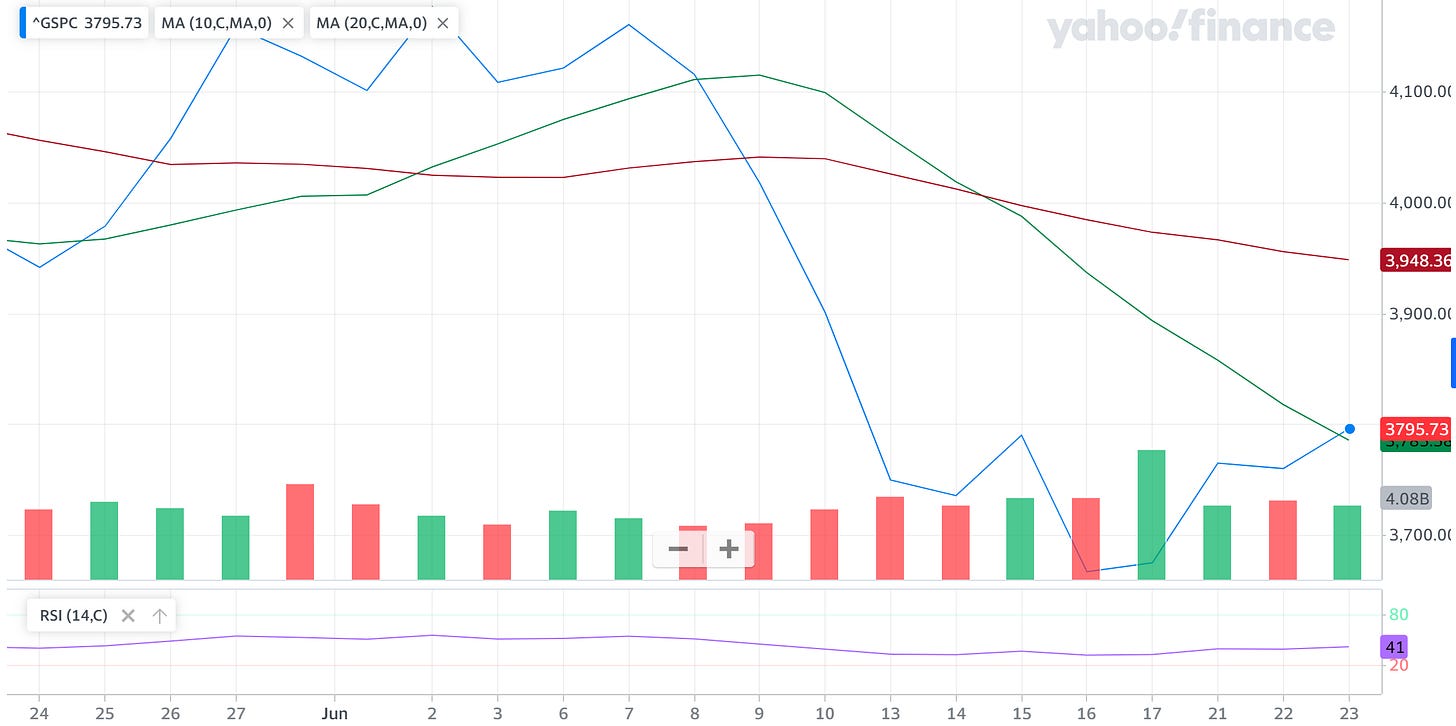
The last few days have been better for the stock markets than the last few weeks. However, I am still waiting and watching for a reversal of the downward trend in order to buy. The S&P 500 1-month chart indicates my point.
S&P 500 short-term indicators
We can see that the 10-day moving average (green line) is still below the 20-day moving average (red line). The price, after what would be called a good week, has barely come back over the initial steep drop. The long-term indicators below look even more worse.
S&P 500 long-term indicators
Here we can see that we had a “death cross” in March 2022 when the 50-day moving average (green line) crossed below the 200-day moving average (red line). The S&P 500 has fallen -13% since then. While it has tried to recover from the downward trend, those attempts have not been successful.
Conclusion
Both the short-term indicators and the long-term indicators are still looking bearish, and I do not see any indication of them reversing yet. That may change as I keep watching and I will make sure I am ready for that reversal. Yesterday, the S&P 500 was up. However, the volatility index measured by VIX was flat to slightly up as well. It is still at a very elevated 29. I am not a betting person, nor do I like to predict. But the market indicators are telling me there is a higher probability of market going down from here than up. So, I am still waiting and watching.


