


Stock Markets Review
I reviewed the stock markets last week and things seemed to be getting better. Although the trending had not turned bullish the price was moving in the right direction. We have had some volatility since then. Although the trending is tracking towards the upside, the price is lower than last week.

What I like is that the 10-day moving average is starting to creep up and should be crossing over the 20-day soon. Maybe even later this week. That for me would be the first indication of a bullish reversal. Note that the S&P 500 is still below its 50-day moving average. That needs to be taken out as well for confirming the bullish reversal.
Let us see the longer-term indicators:
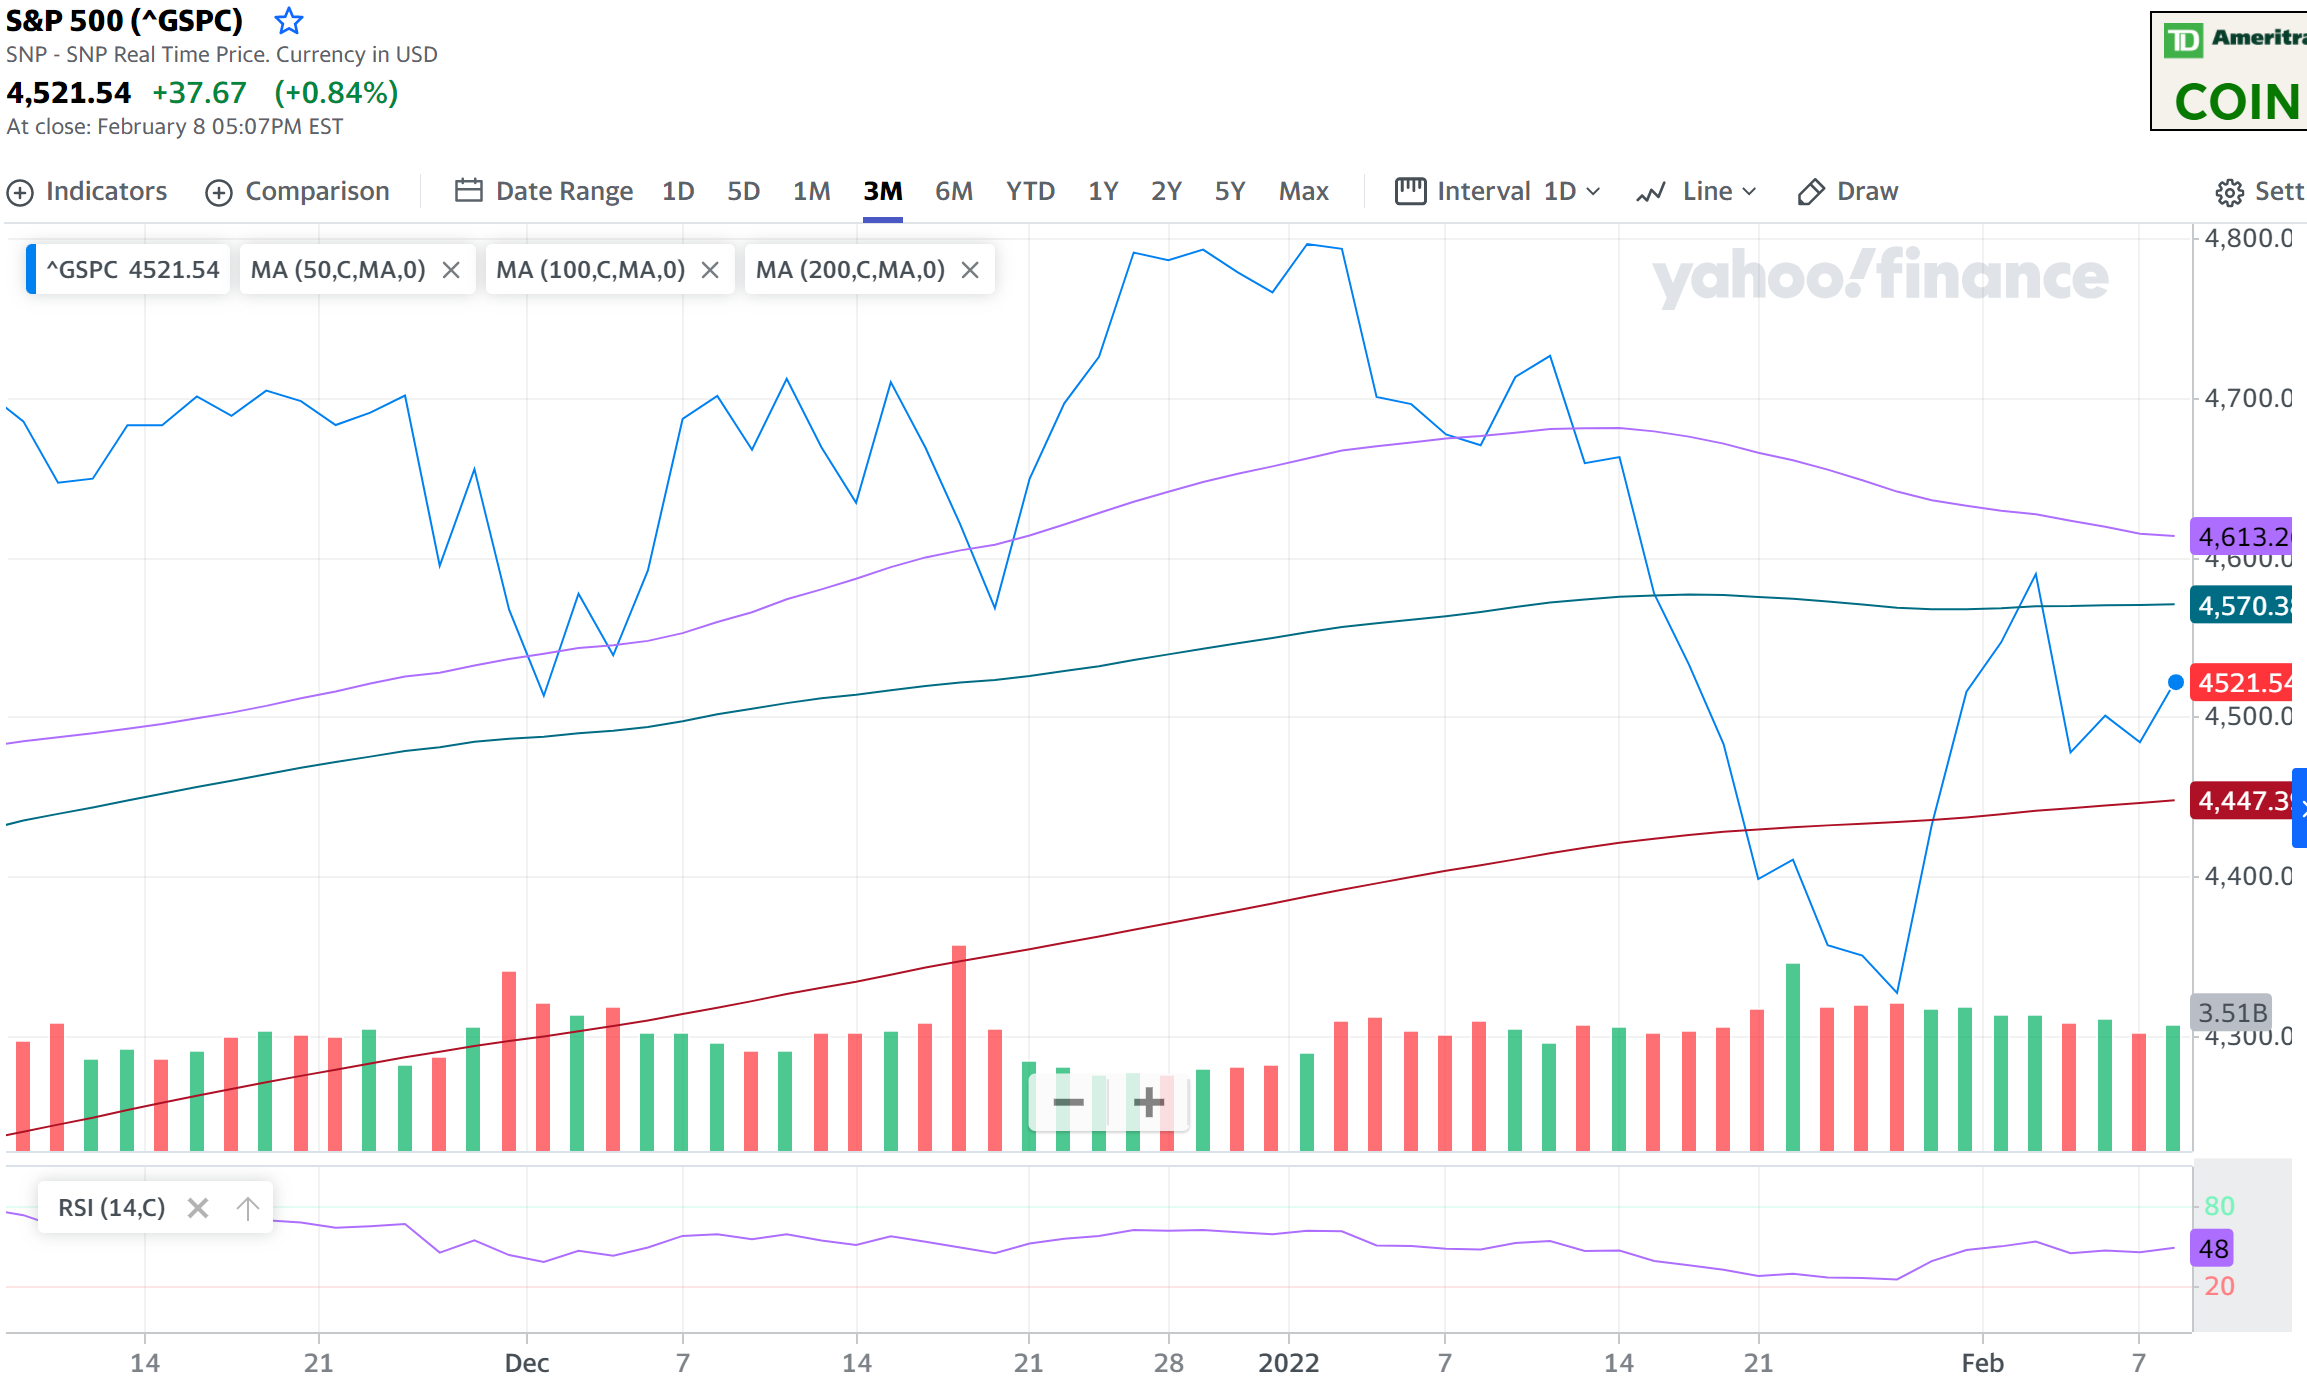
The good news here is that the indicators are all in their own place where they should be. There was some danger of the 100-day and the 50-day both looking to cross below the 200-day moving average. Now that risk looks lower even though not impossible.
The bad news is that the S&P 500 is still close to its 3-month lows, and it is also below the 100-day moving average. Those have to reverse for us to call a bullish reversal.
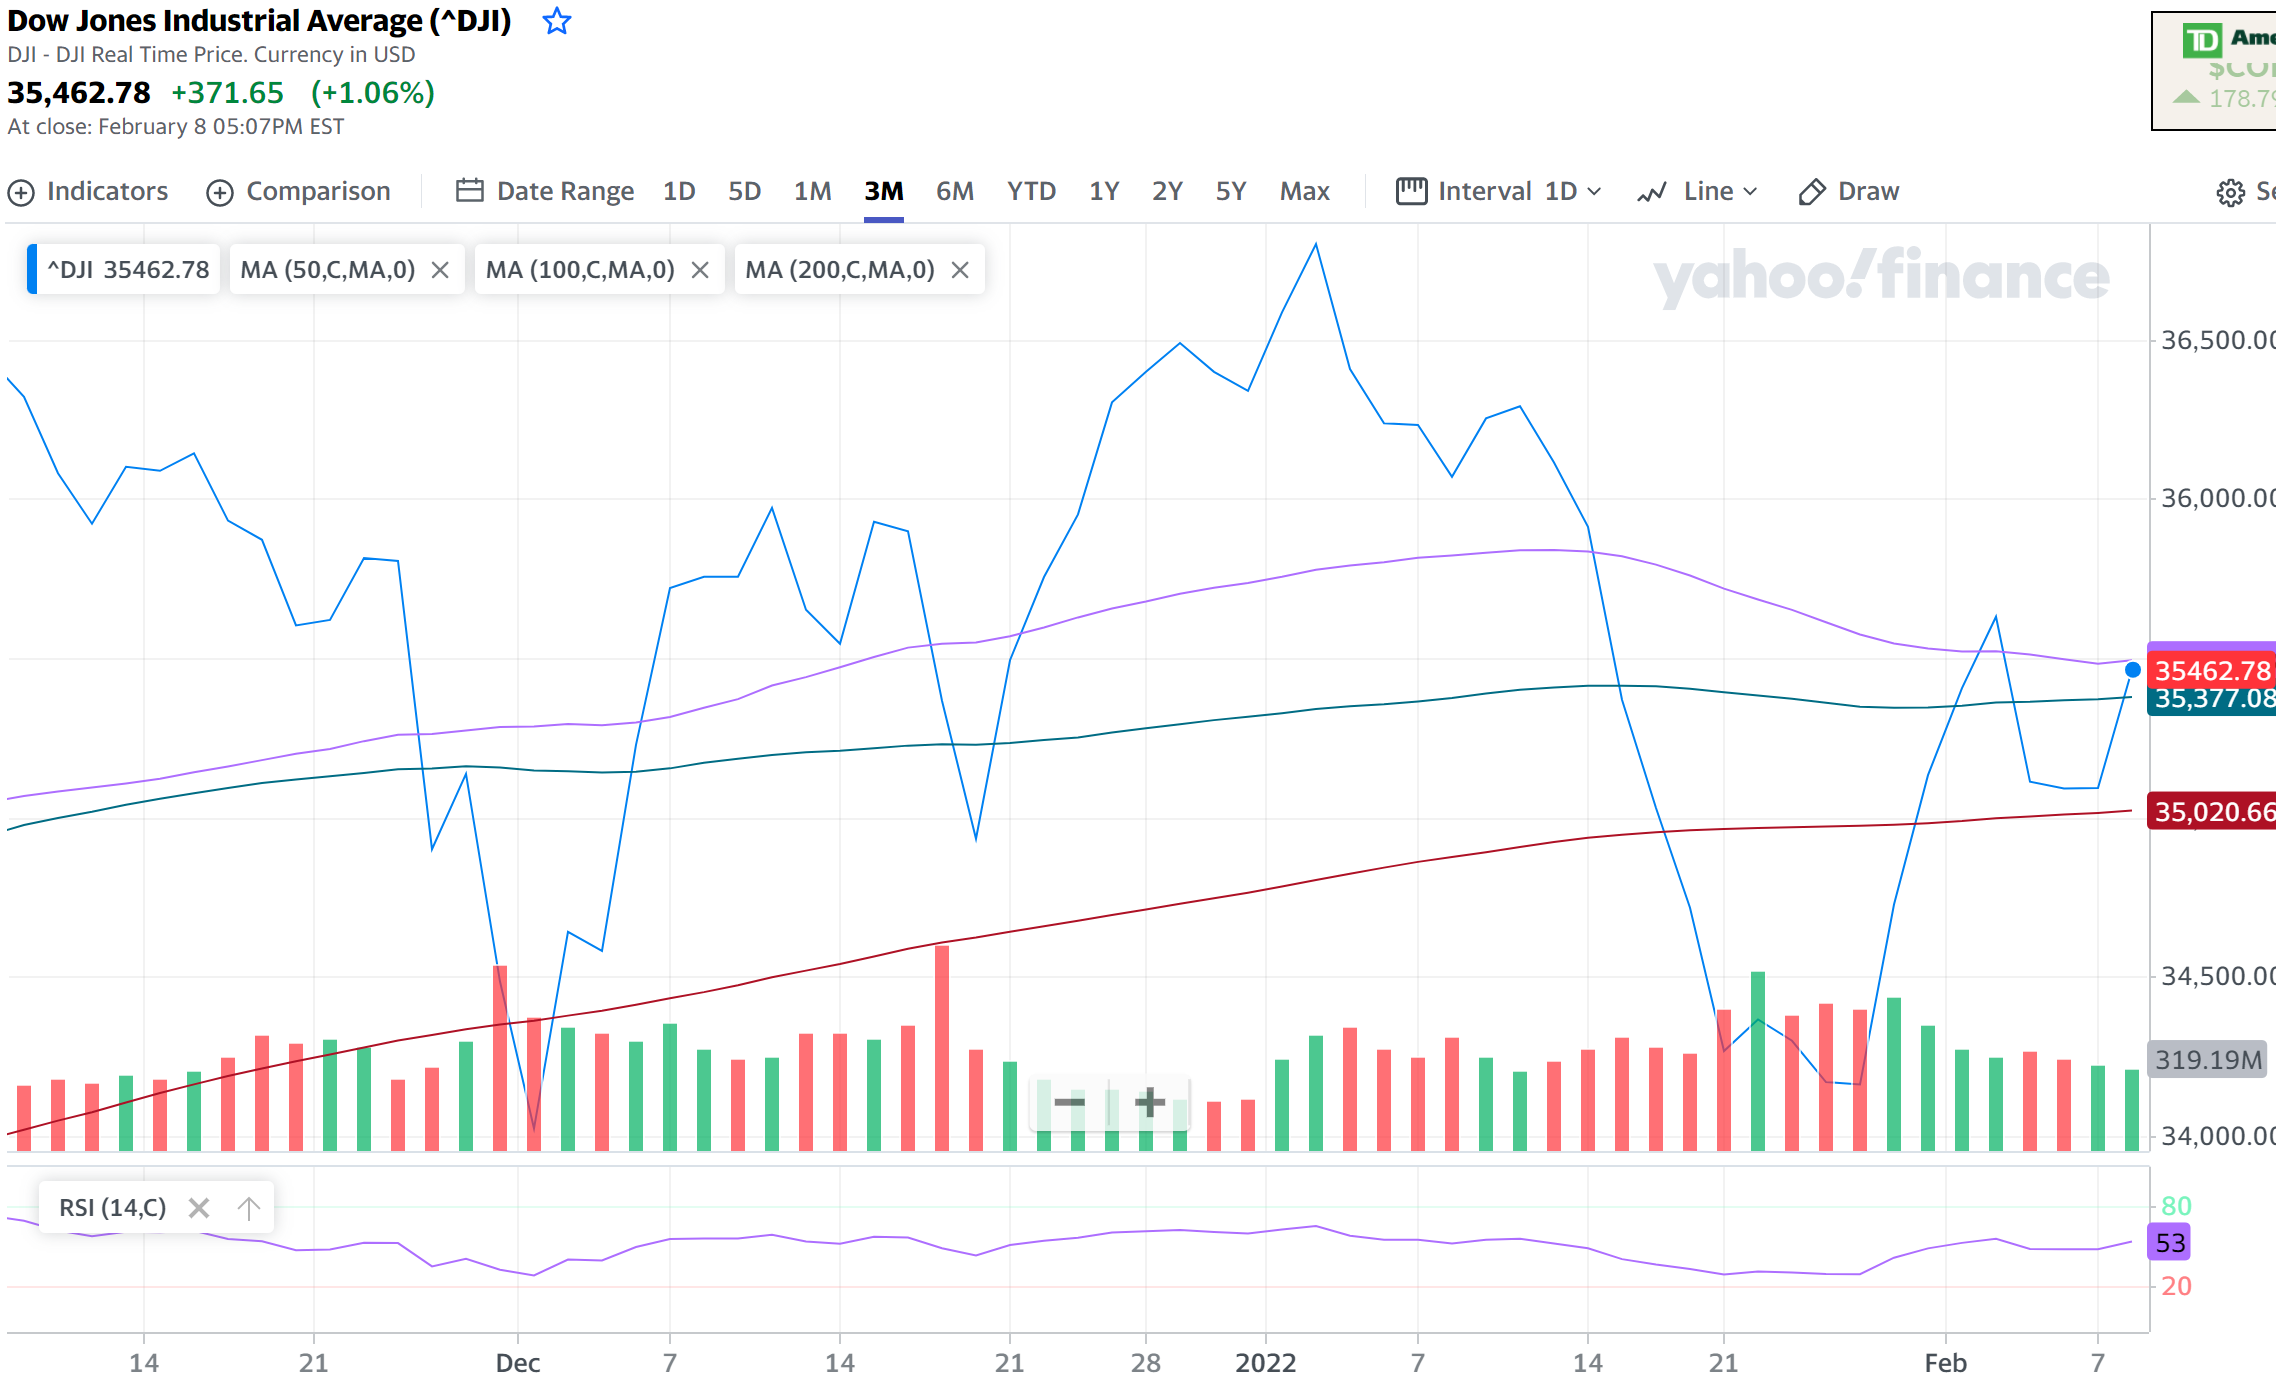
The Dow Jones indicators are looking similar to the S&P 500. But the 3-month chart looks choppier. Definitely times of high volatility.
The NASDAQ is actually the worst at this time. The 50-day moving average has crossed below the 100-day moving average. It is also looking close to the 200-day moving average and unless the price rallies strongly, that death cross may happen.

Finally, I like to check the Volatility Index VIX, and the chart below shows the volatility has reduced. However, it is still high at over 20. Having said that the recent high was 32. So, it has certainly come down.
The 1-year VIX chart actually tells a better story and the volatility that we have encountered over the full year.

Stable markets are seen when the VIX is between 15 - 18.