

Stock Markets Review
Stock markets are still struggling to recover from the January downtrend. Things have got worse from my last week’s review. The S&P 500 has fallen about -2.5% in the last 6 trading days.
From a short-term perspective, the S&P 500 has dipped below its 10-day moving average which is short-term bearish. The 10-day moving average is still over the 20-day which is good. However, the trendlines indicate that it may change soon. The next 2 trading days of this week will determine that.
Note that the S&P 500 price is also below the 50-day moving average. It will need to rise about +2.8% to take out the 50-day which would indicate somewhat of a safe bullish reversal for me.

The longer-term moving averages are still ok not having crossed each other. The price is hovering over the 200-day moving average (in red).
Overall, the S&P 500 is definitely still trending bearish to neutral.
How about the Dow Jones and the NASDAQ? Below is the year-to-date comparative chart of S&P 500 against the Dow Jones and the NASDAQ.
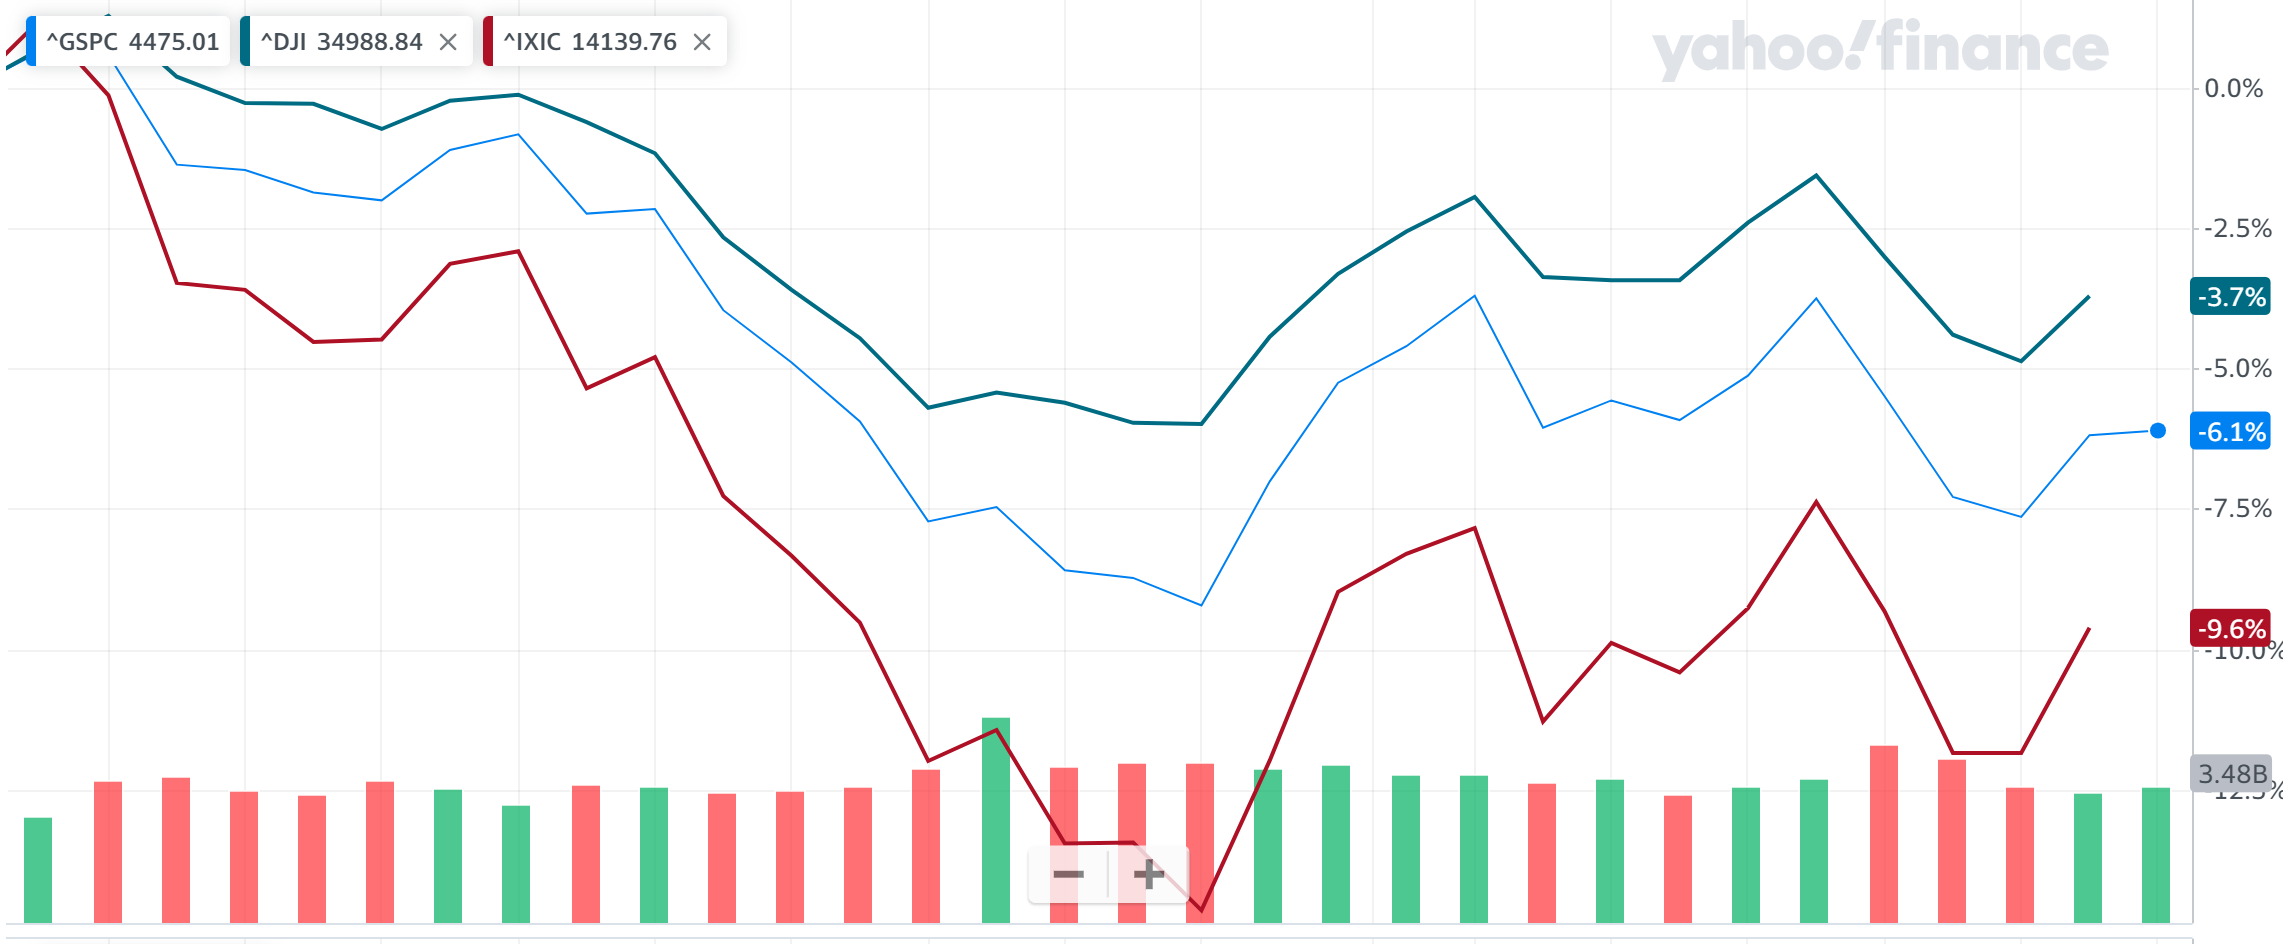
We can see that all of them are down in 2022 so far. The NASDAQ is the worst down -9.6% and the Dow Jones the least down at -3.7%. Interesting to see that the NASDAQ has been hit the hardest.
And this is not a recent phenomenon as we can see from the 1-year comparison below.
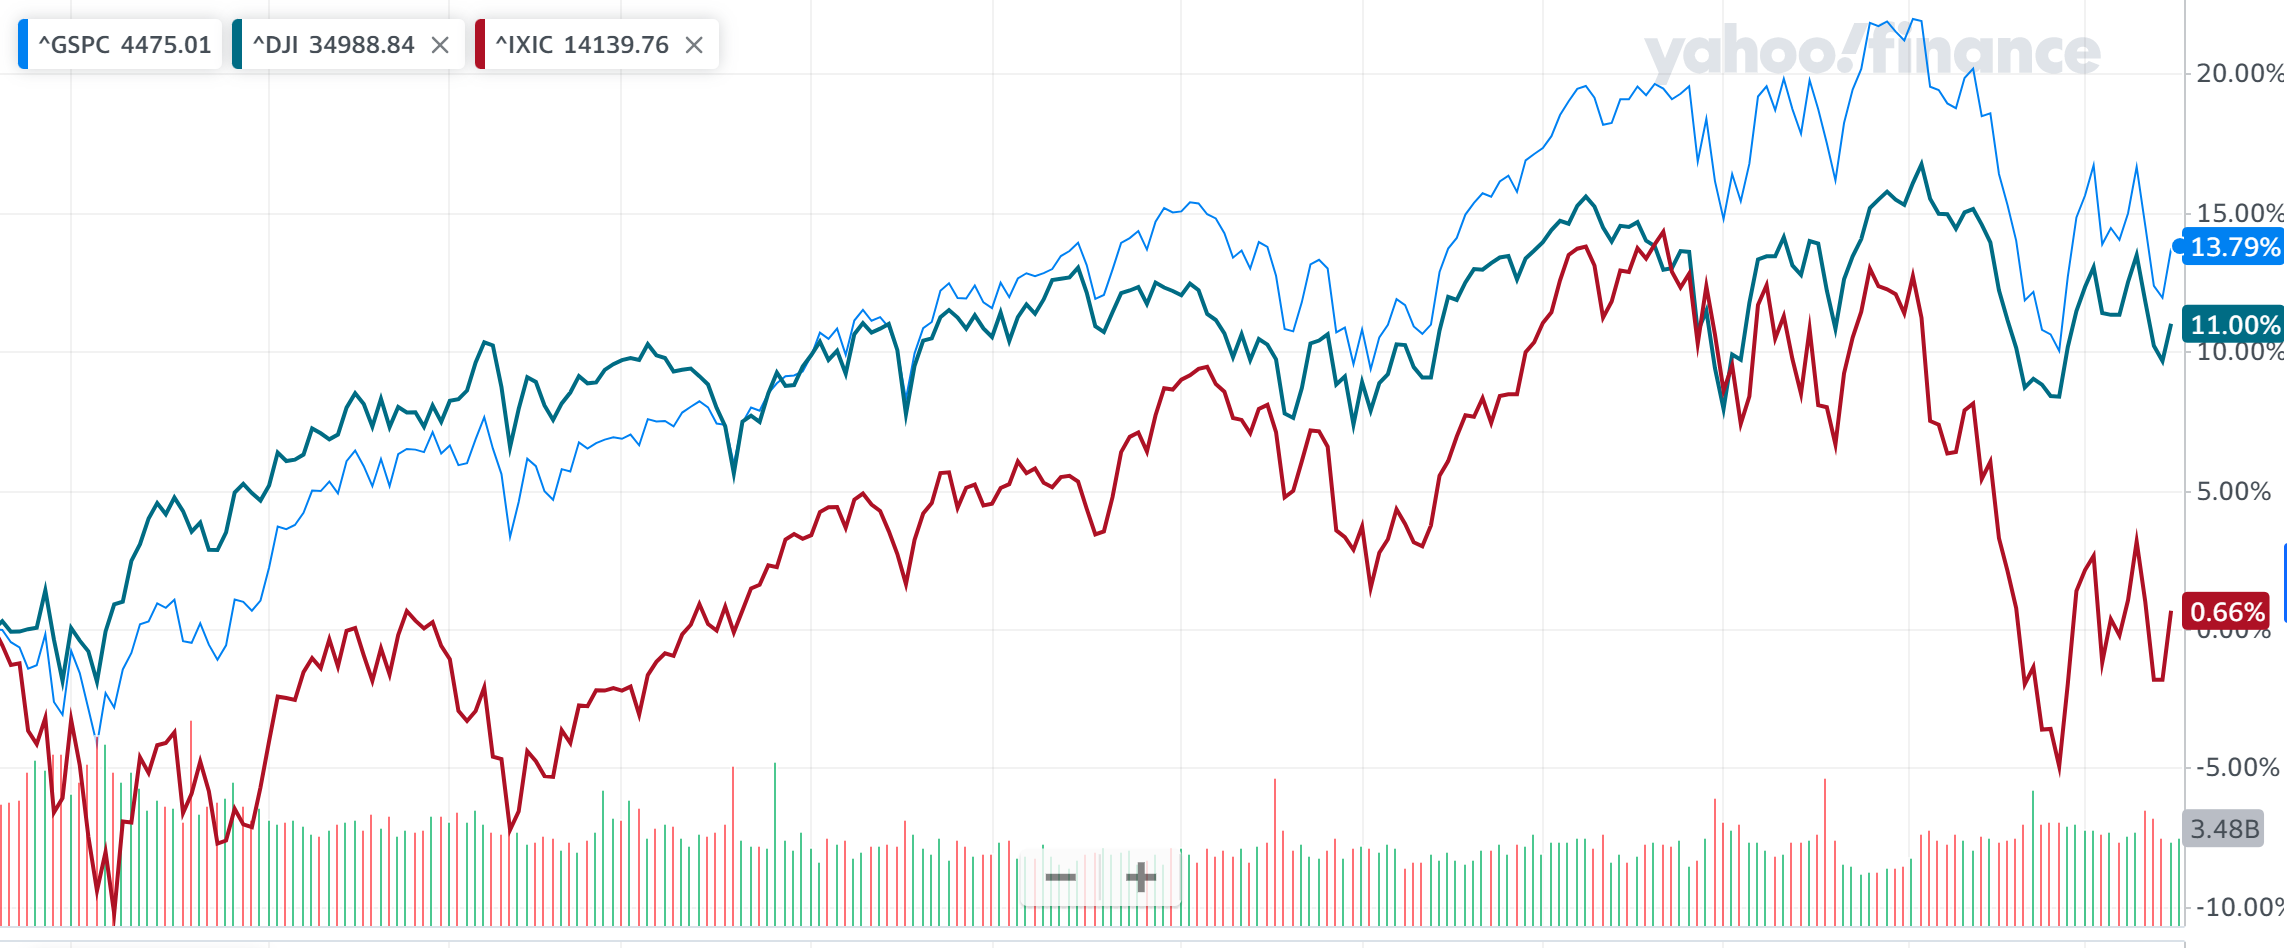
We can see that the NASDAQ has just been flat overall while the S&P 500 has gained +13.79% and the Dow Jones +11%.
We all know that markets go down and markets go up. Trends are always temporary. Some trends are short-term, and some are long-term. But eventually they always reverse.
It will be interesting to see who leads the bullish reversal this time. The NASDAQ has been the weakest, so will it jump the quickest and the highest. Time will tell and I will track.