Stock Market Sector Assessment
The stock markets bounced back on Friday and the S&P 500 actually ended up higher last week. Not by much but still good news. The Dow Jones was also up for the week while the NASDAQ was flat. Most market experts are saying we have seen the bottom and the markets will stabilize going forward. The proof of that will obviously be seen through price action next week and beyond.
I wanted to look at the sectors a little more closely today. And I wanted to change up the view a little bit to look at which sectors have remained strong during this volatility and which ones have been weak. I look at this by seeing how much below their 52-week high they are.
Note that the S&P 500 as of today is down -7.92% from its 52-week high. Here is the full picture:
So, only 4 out of the 15 sectors that I track have done better than the overall S&P 500. These are the Energy, Utilities, Financials and Industrial sectors.
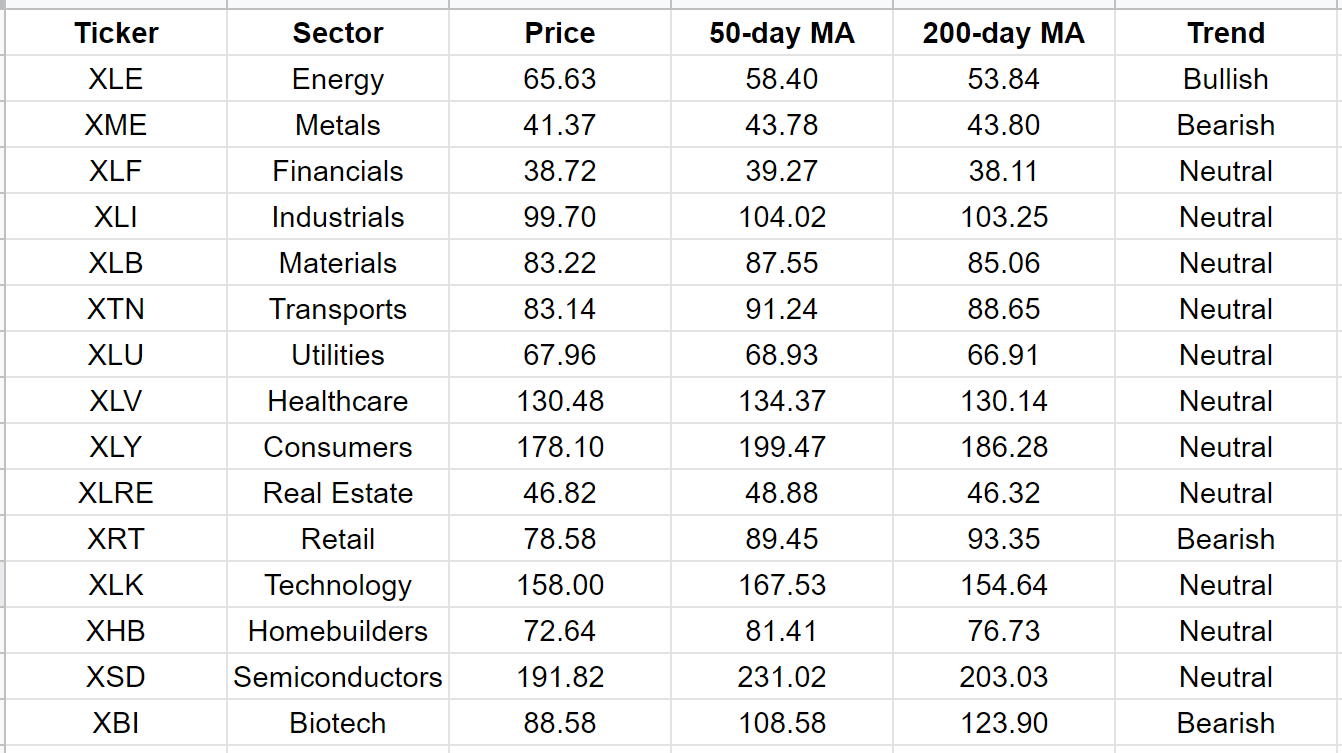
The other interesting aspect I wanted to review was their long-term trending. I do that by comparing their price with the 50-day and 200-day moving averages. Using this I can define bullish, bearish and neutral ratings against these sectors. Here are the simple rules:
If Price is above 50-day moving average AND 50-day is above 200-day moving average, then it is trending bullish
If Price is below the 50-day AND the 50-day is below the 200-day moving average, then it is trending bearish
All other situations the trending is neutral
I market only the Energy sector as trending bullish.
The Metals, Retail and Biotech sectors are trending bearish.
Let us see what happens next week.


