


Stock Market at All-Time Highs; Now What?
Hint: I am going to let the rend be my friend.
The SPY and QQQ both hit all-time highs Friday. So, where do we go from here? For me, as long as the trending is bullish, I will remain long. And there are clear indicators that I will be watching to confirm that the trending remains bullish or not.
Most of you know what those clear indicators are. The top 2 are:
The 20-day moving average -
Is price above this?
Is the 20-day rising?
Is the 20-day still below the 5-day and the 10-day?
If the answers to all these 3 questions are “yes” then the trend is intact. If any of the above is “no” then I start to look more closely.
Is the price action still making higher highs and higher lows?
If the answer is “yes”, then the trend is intact. If “not” then I got to watch more closely.
I also review the MACD and the RSI as secondary set of indicators. I do not take actions based on that though.
So, here is the SPY daily chart:
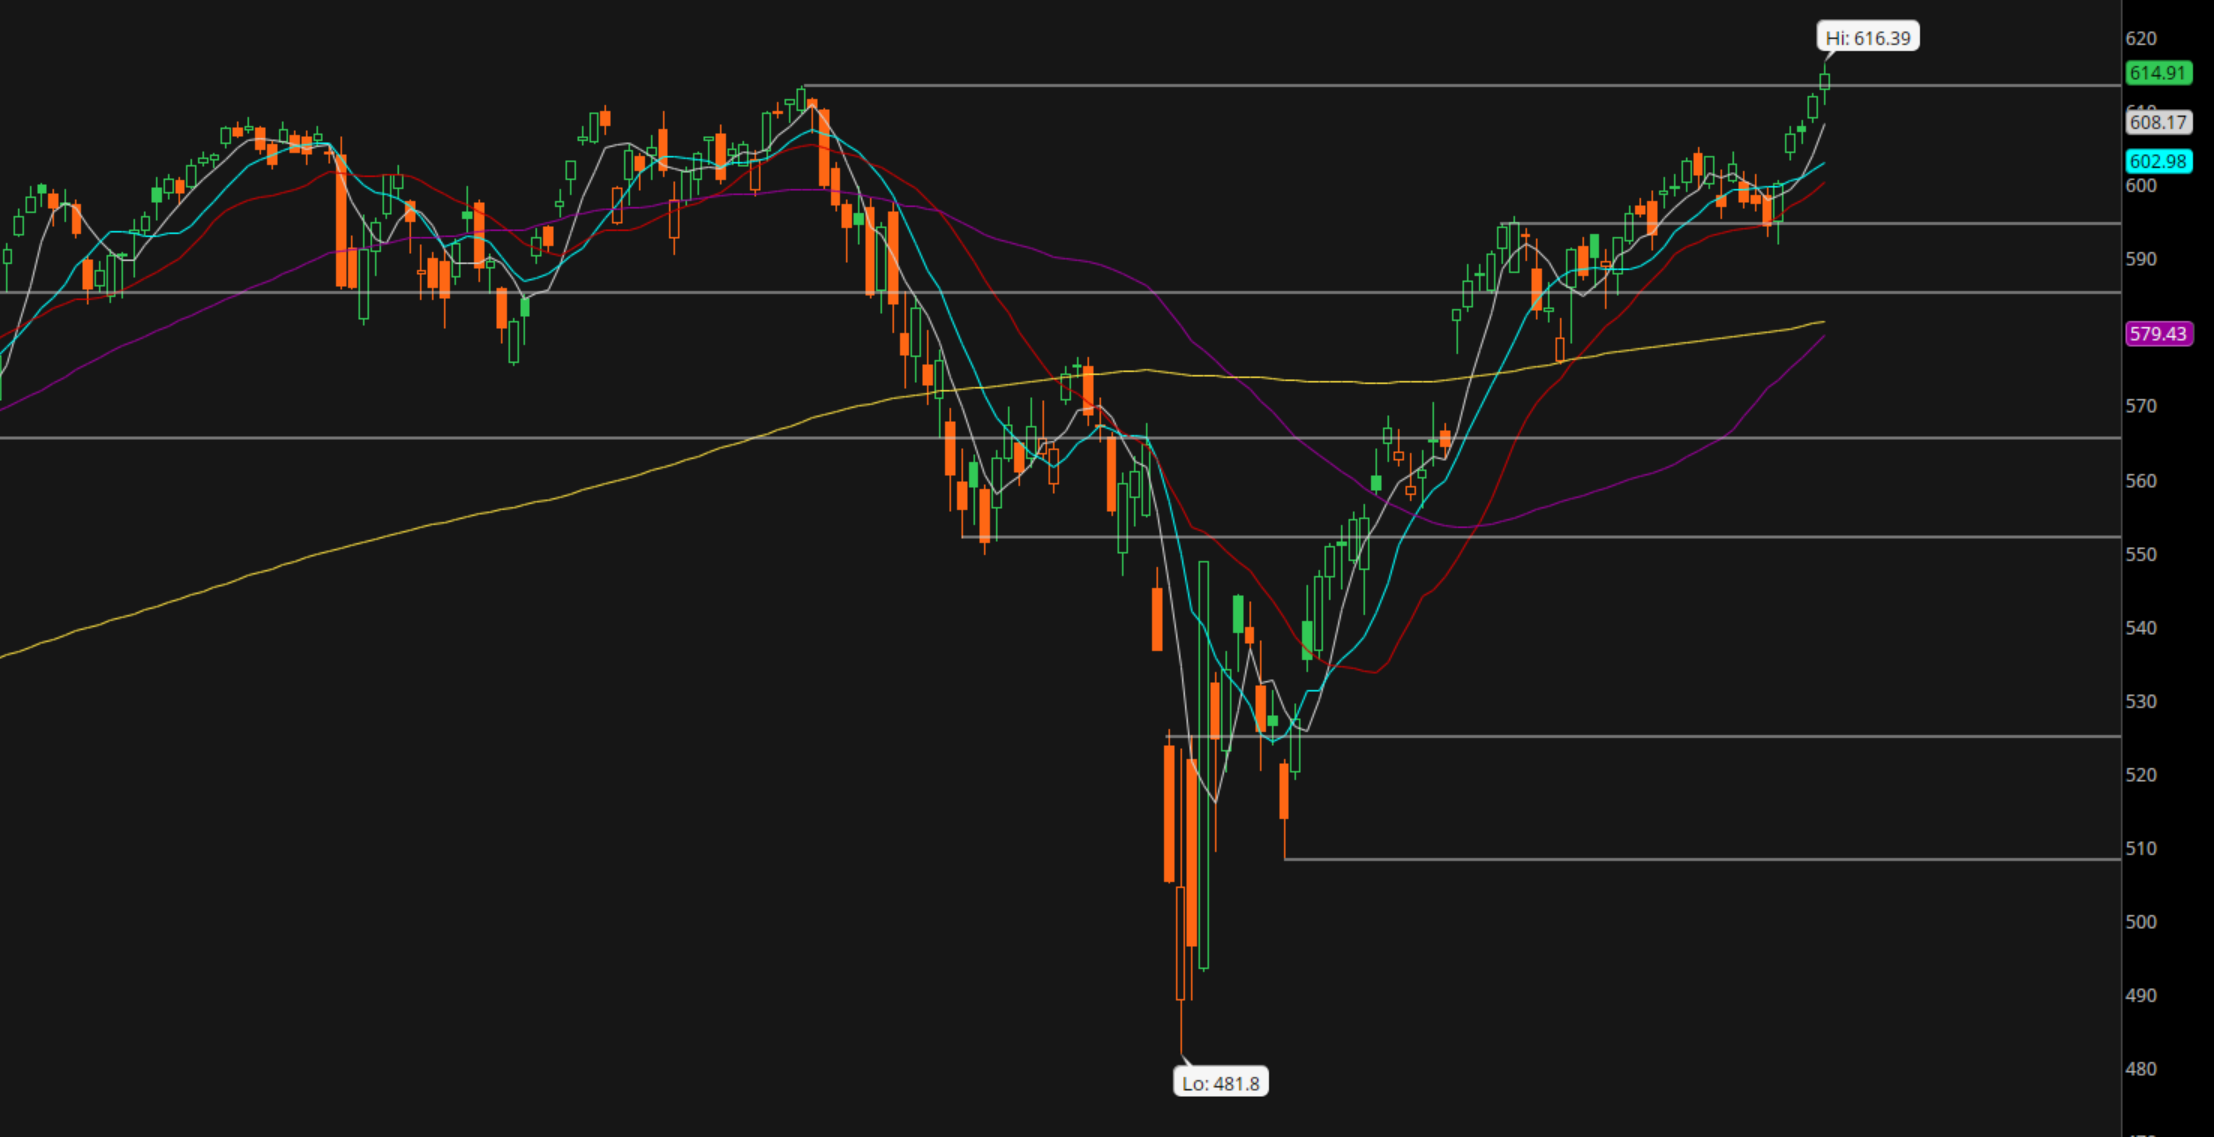
Using the criteria described above, I can see that
The 20-day moving average (red)
Price is above that
The 20-day is rising
The 20-day is below the 5-day (gray) and 10-day (green) moving averages
The price action is still making higher highs and higher lows.
That satisfies my criteria that we are still in a bullish trend.
The same situation holds true for the QQQ. See the daily chart below:

Note that the RSI for the QQQ just went over 70 which is considered overbought territory. However, as I mentioned above, I consider the MACD and RSI as secondary indicators. I do not take action based on them. The reason for that is MACD moves faster than the simple moving averages and can give too many signals. And price can remain in overbought (or oversold) territory as indicated by RSI for a long time. So, these are not decisive indicators for my system.
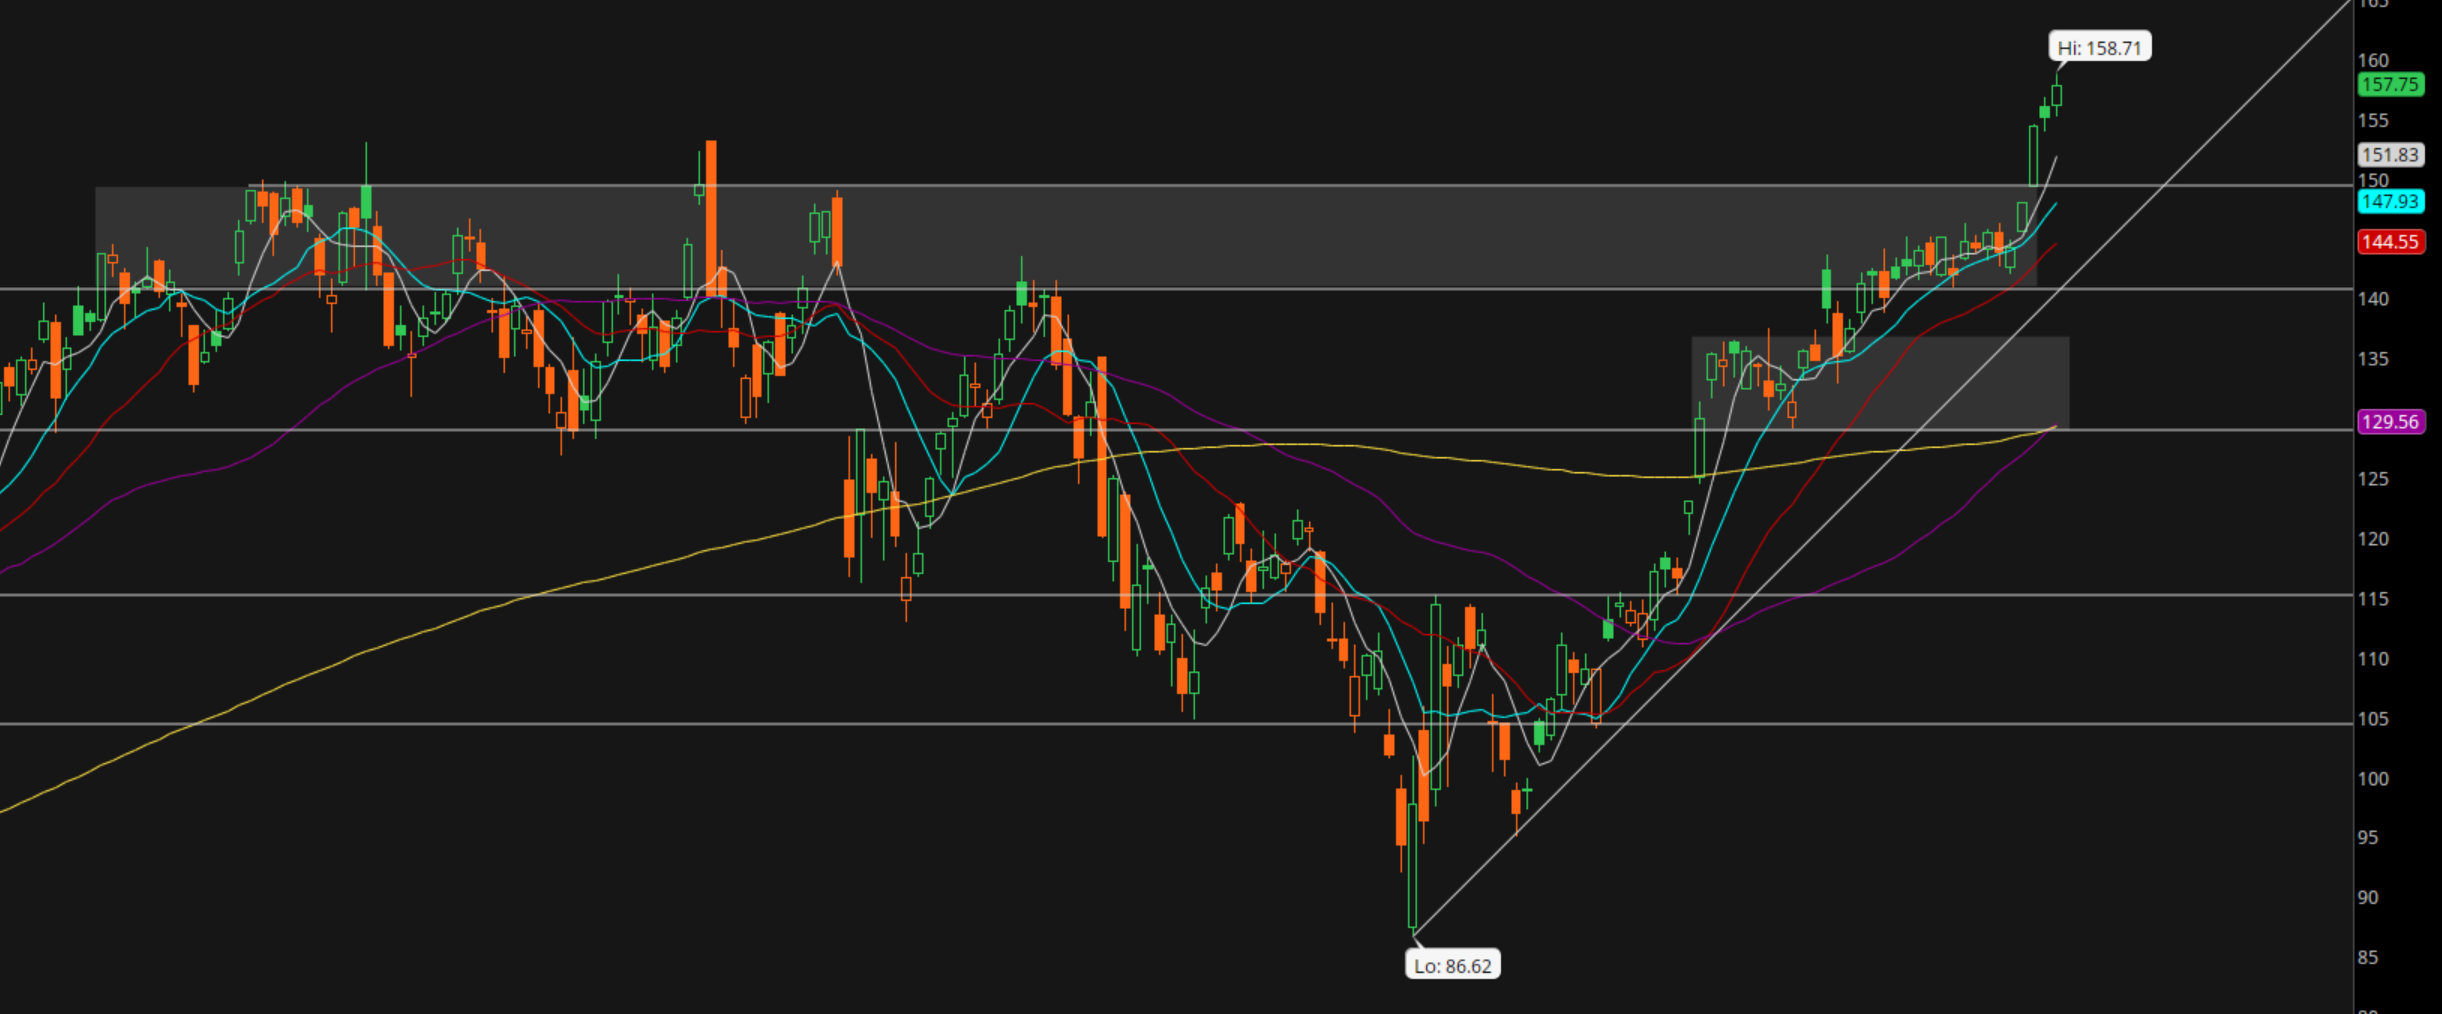
Interestingly, the IWM is also trending bullish. Here is the daily chart:

Last week price made a higher high. The price did also go over the 200-day moving average (yellow) but closed just below that. However, price remains above the 20-day MA (red) and is making higher highs and higher lows within that upward moving channel.
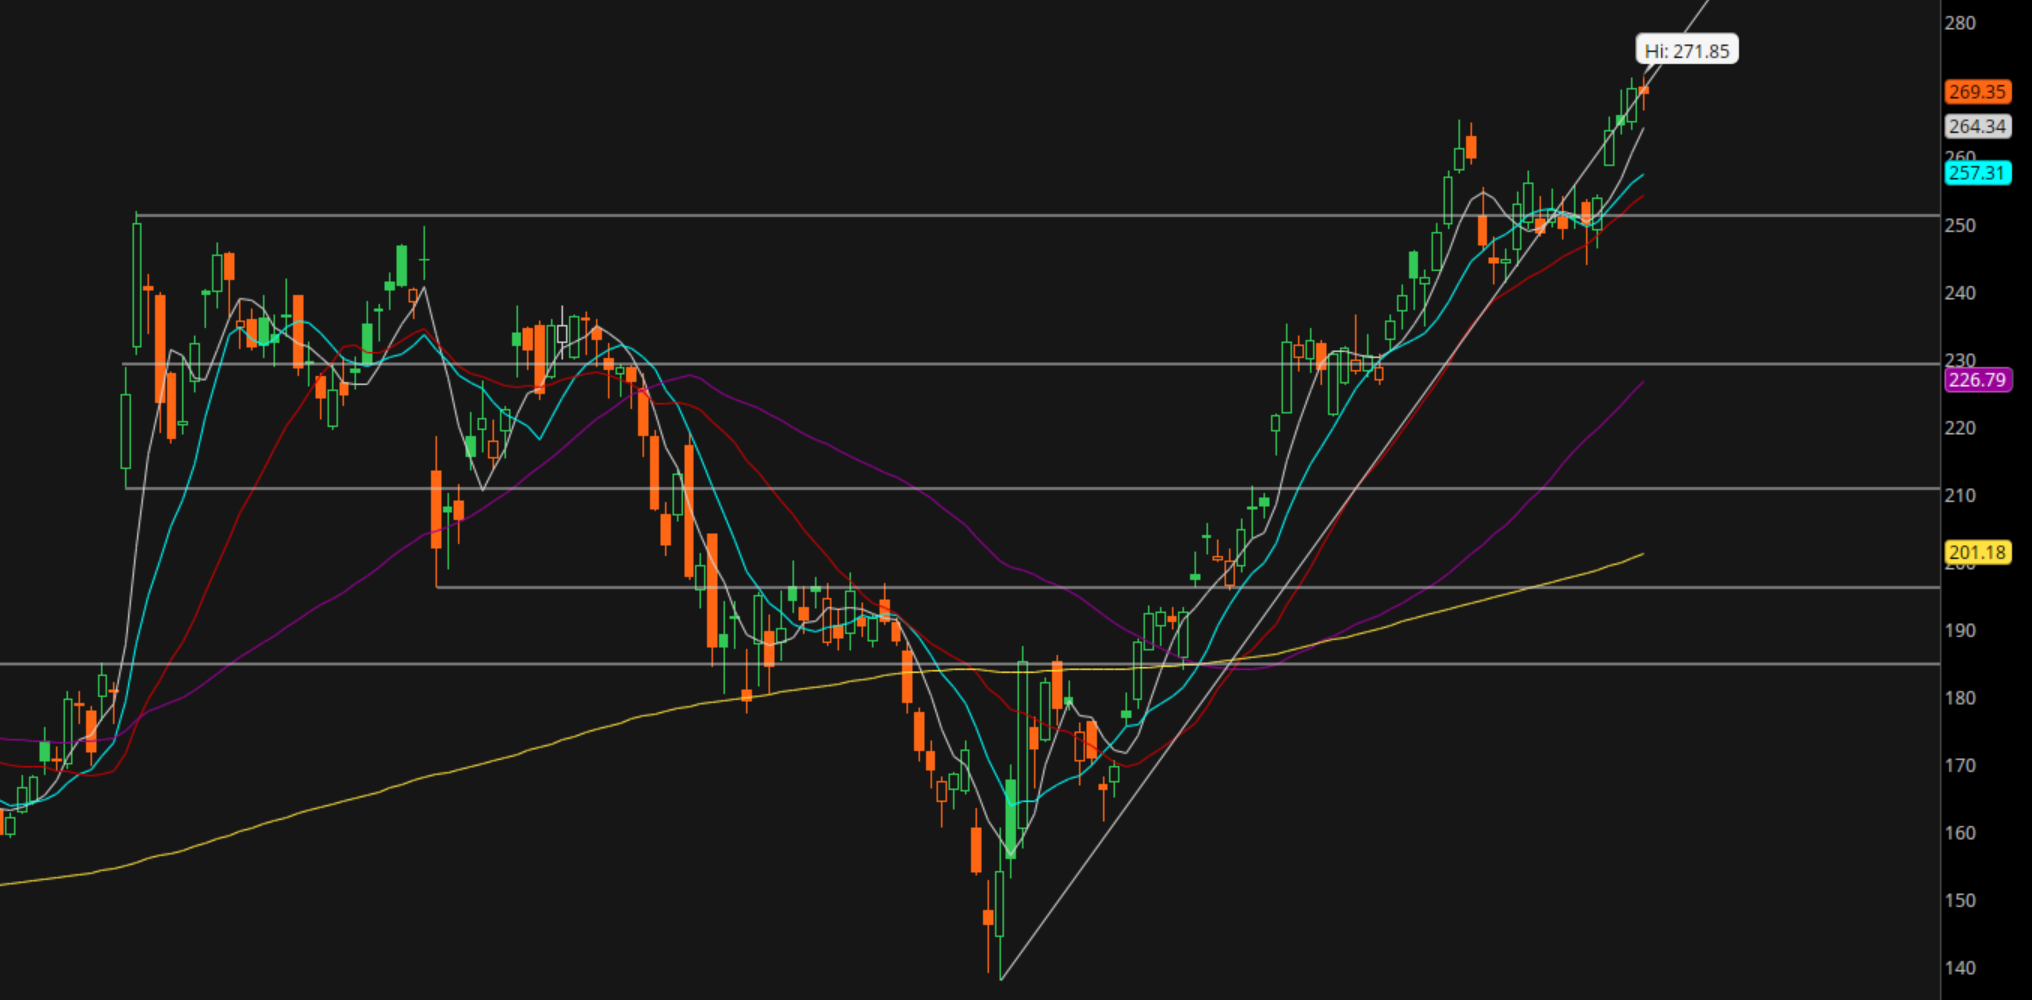
The more interesting chart is that of the RSP.

Price has decisively moved above the 200-day moving average (yellow) and also made a higher high. This is good because earlier it had made an equal high and it seemed to have some difficulty. Now this is looking like a bull flag pattern.
The RSP showing strength indicates a broadening stock market where the other 493 stocks are also doing good. I mean the other 493 than the Magnificent 7 in the SPX. The strange thing though is that only 3 stocks in the Magnificent 7 have performed better than the SPX this year so far:
META +25.30%
MSFT +17.66%
NVDA +17.47%
The SPX is up 2.39%. And the other 4 from the Mag 7 are all lower than that:
AMZN +1.78%
GOOGL -5.69%
AAPL -19.70%
TSLA -19.86%
So, maybe the RSP being bullish is actually an indication that the Mag 7 is no longer pulling it down.
At any rate, the bottom line is that all stock markets rea trending bullish. So, there is every reason for us to stay bullish.
Now I will review a few stocks that I am bullish on and holding or adding.
=====
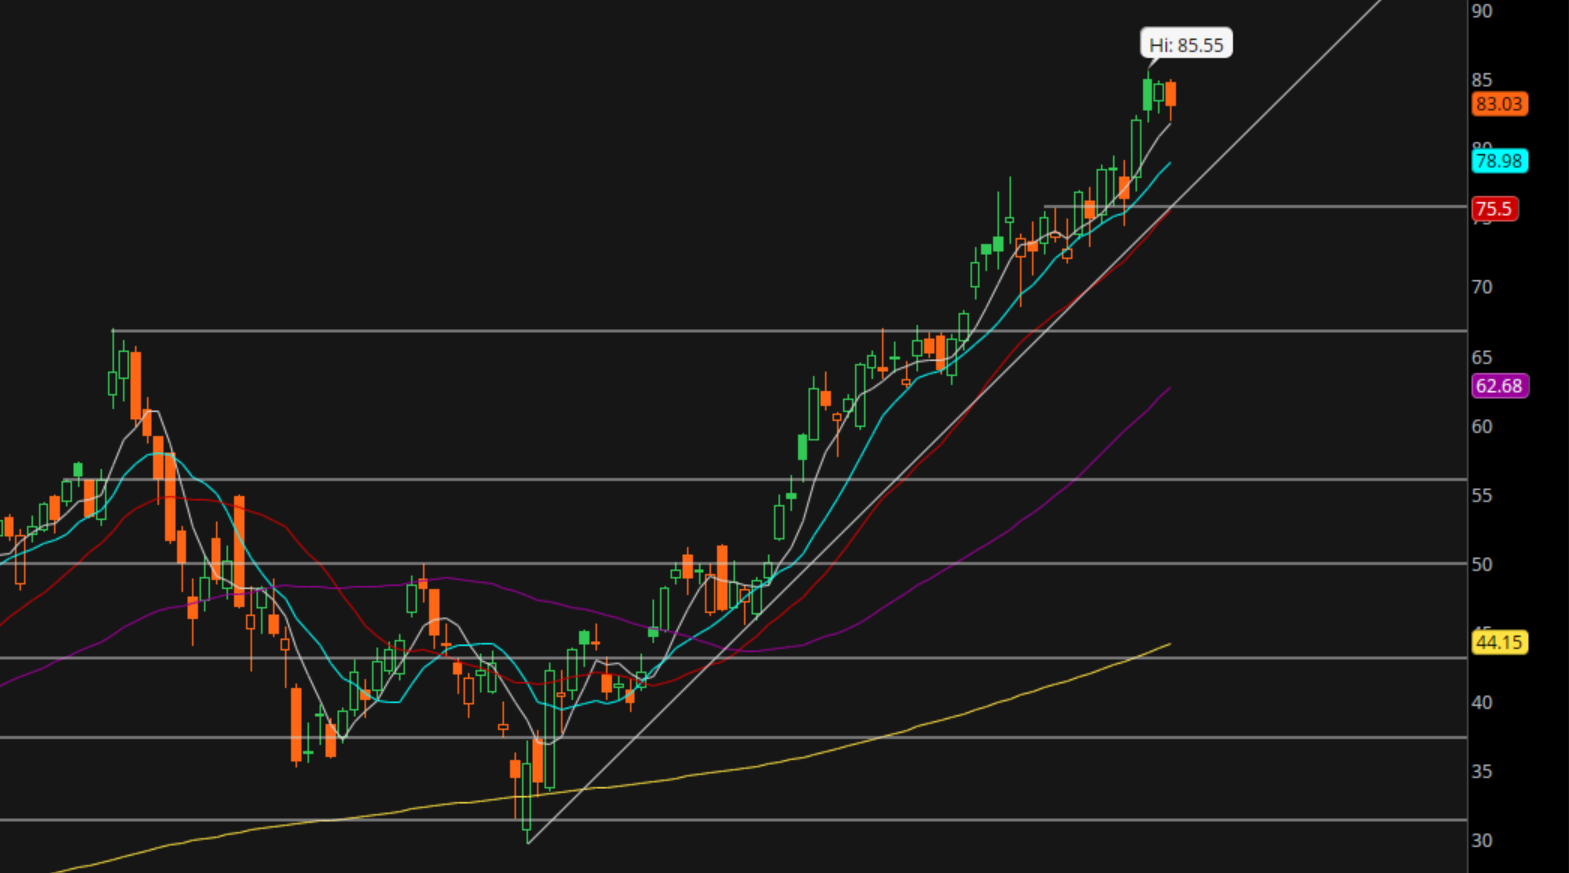
PLTR

The price fell by -9% on Friday for no apparent reason. Maybe it was just profit taking. The price did fall below the 20-day moving average (red). But the 20-day is still rising. Plus the 5-day (gray) and 10-day (green) moving averages are still above the 20-day. And we are still in a price action making higher high and higher low. So, I am not going to worry yet. If price reverses and gets back over the 20-day I may add.
=====
HOOD
Still is a perfect chart. Nothing needs to be said.
=====
COIN

Price shot up over the last 2 weeks and now all the moving averages are rising. The 2-week rise was from around 240 to a high of 380. So, there is bound to be some rest that it needs. Friday price was down around -6% but price did bounce off the 5-day moving average (gray).
=====
NVDA
Price made new all-time highs last week after overcoming a few resistance levels. This bodes well for the overall stock market as well.
=====
AVGO
Price making news highs.