


SPY Trending
The indecision in the markets continued last week. The SPY was up first 3 days of the week and then down the next 2 days. Overall, it still managed to eke out a gain.
Here is a high-level view of the major markets to set the context for the next week.

I want to review the SPY daily chart in detail today.
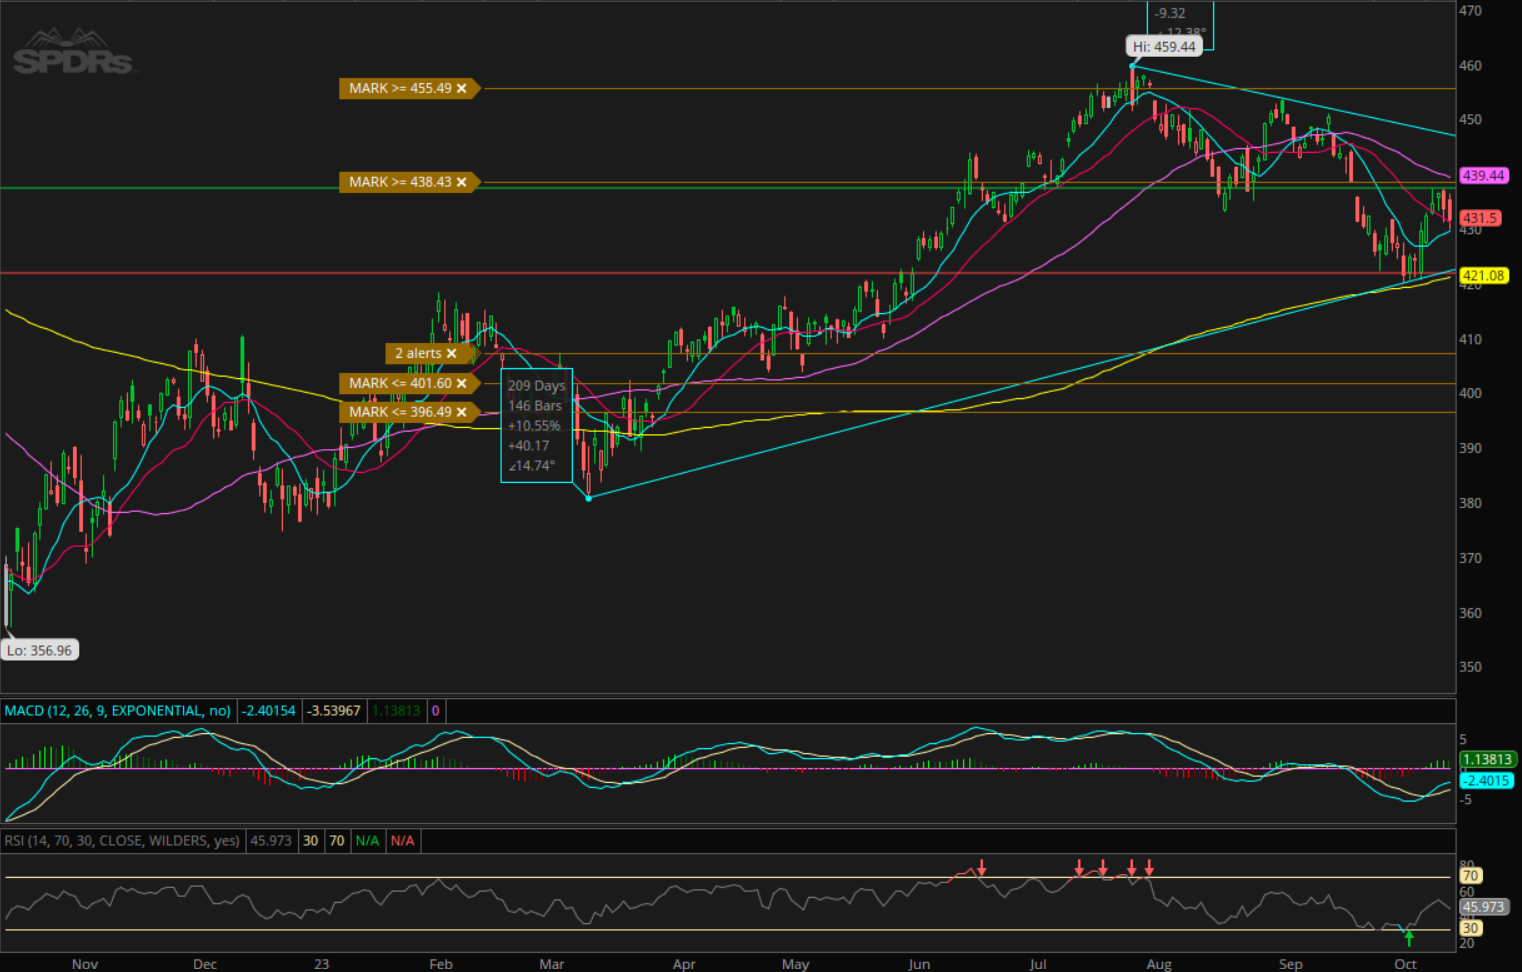
The SPY price is just over the 10-day and 20-day SMA and below the 50-day SMA. It is trying to move up but not quite there yet.
The price this week closed just round the middle of the expected move (slightly to the higher side), so that leaves it neutral.
We can see that price has tried to break out above the downward trending line twice and failed. That line now is at around 446 but will keep going down every day. So, we can watch for whether price can break that trend.
There is also an upward trending line which I have drawn from March 13 low price touching recent lows that price hit. That now seems to be the low that price can go.
Combining these 2 trendlines we get a wedge through which price, at some point in time in the future, has to break in one direction.
We can see that the MACD histogram had turned positive but lost some steam over the last couple of days.
Now, let’s look at the weekly SPY chart.
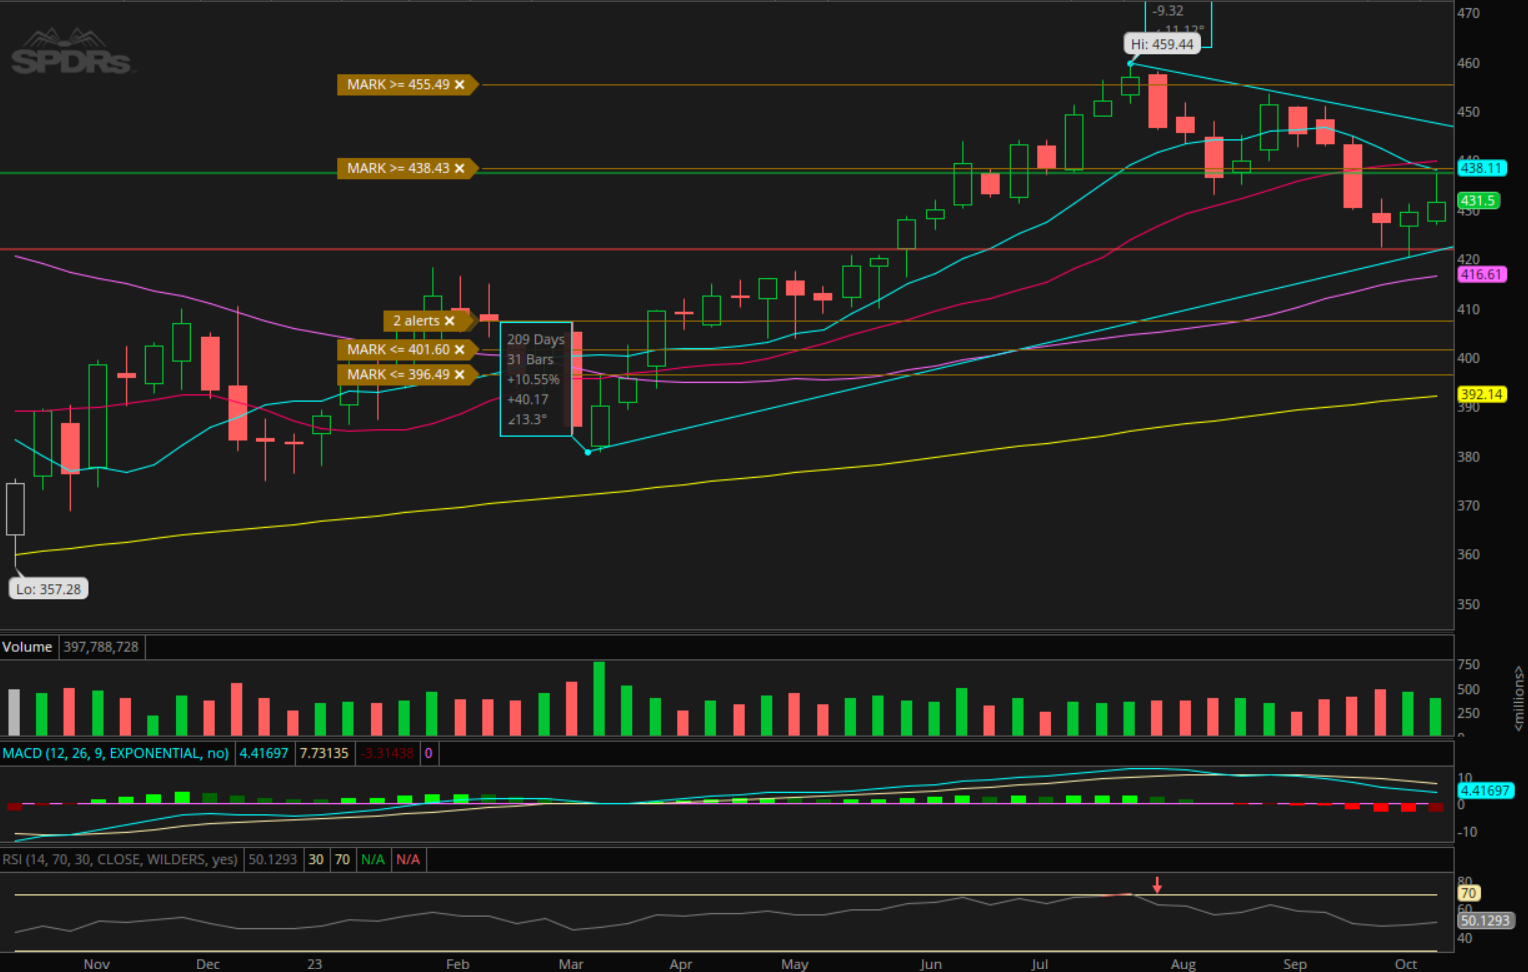
The most glaring thing I see is the 10-period SMA crossing below the 20-period SMA. Plus, the MACD histogram is negative.
And finally, the hourly SPY chart.

This also does not show the SPY price trending in a good light. t looks distinctly bearish.
Here is the overall trending heat map with the other major markets thrown in as well.

Strategy
There is nothing to like on the bullish side for the major markets. Although the QQQ seems to still be trending bullish on the daily charts, the strength seems to be weakening.
Short-term traders have to be nimble and play the market as it develops. Long-term traders may need to wait for a bottom to form or a distinct downturn to form to take up positions in the right direction.