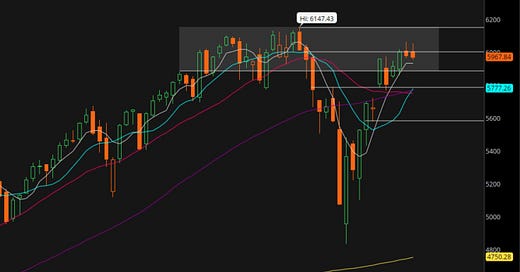
Checking the $SPX trending
for the upcoming Week 26
the halfway mark of the year
starting with the weekly chart
=====
SPX Weekly chart
Each candle is a week and the chart goes back to April 2024. We can see a bit of weakness. Yes 2 down weeks constitutes weakness in the kind of market we have been in since April.
But $SPX price remains above the 5-week (gray), the 10-week (green) and the 20-week (red) moving averages. Moreover, the 10-week just crossed over the 20-week. The 20-week MA was declining and now flat. The 5-week was rising and now flat. Overall, from a weekly perspective, the $SPX remains bullish.
=====
SPX Weekly MACD and RSI
The MACD for $SPX on the weekly chart looks bullish. The MACD line is over the signal line with histogram positive. The lines are both rising from below the 0 level so that implies the rising trend could have legs.
The RSI for the $SPX on the weekly chart has been rising after being oversold end of March 2025. The RSI is at 56 and rising indicating there is room to run for price as we are far away from overbought levels.
So, the MACD and RSI are confirming the $SPX bullish trending on the weekly charts.
=====
SPX Daily chart
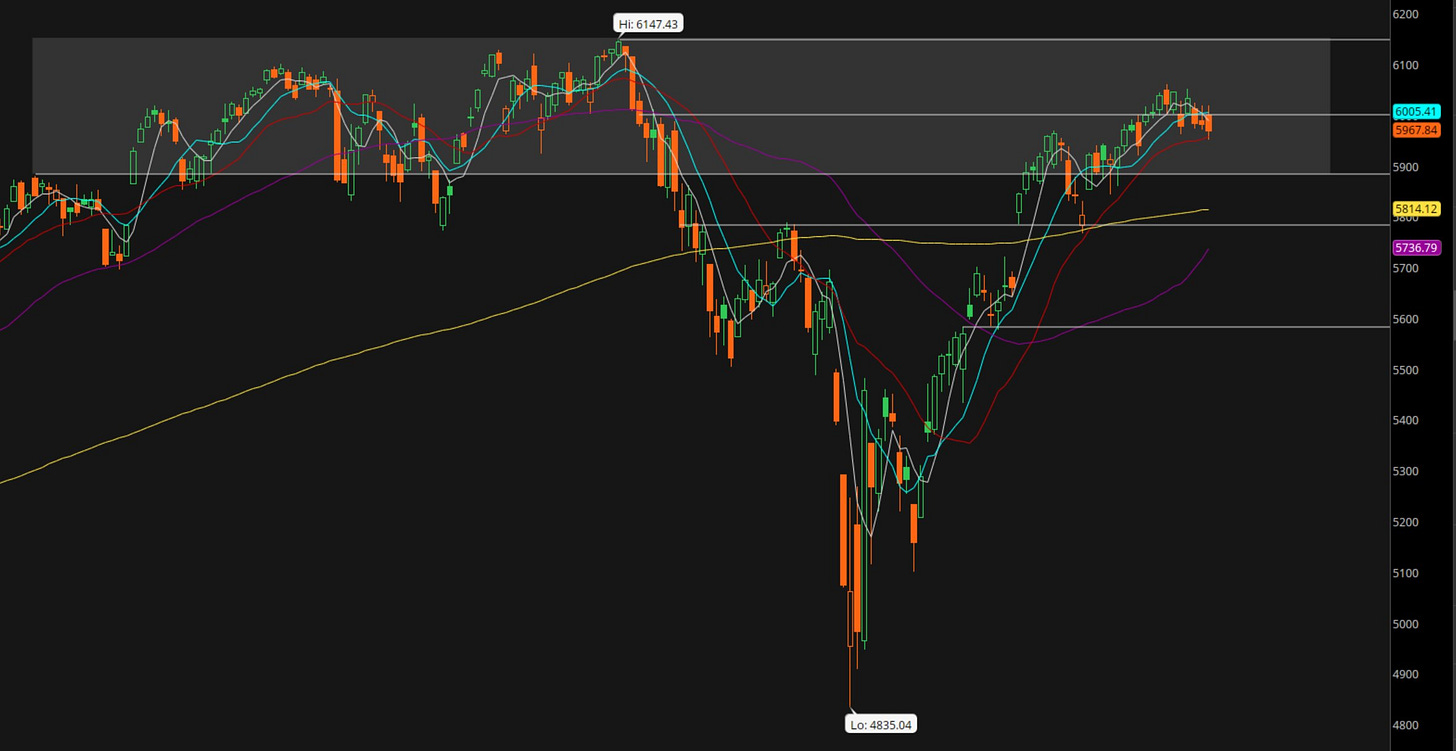
The most important thing I notice in the $SPX daily chart is that price bounced off the 20-day moving average (red). That tells me that at least for now the $SPX bulls are ready to step up when needed.
The $SPX price did fall under the 50-day (gray) and the 10-day (green) moving averages. So, there is some weakness confirming what we saw in the weekly chart.
The 10-day and the 20-day are still somewhat rising. Although the 5-day is now declining. Note that the 50-day (purple) and also the 200-day (yellow) moving averages have started rising as well.
The $SPX price action is still making the higher highs and higher lows. As long as price does not fall below 5786, that trend will have been maintained.
The $SPX price action remains inside that battlefield zone where I had expected it to feel some pressures. After all, that is the zone (shaded area) where we have seen much trading volume in the past.
=====
SPX daily MACD and RSI
We can see that the MACD on the $SPX daily chart has turned bearish. The MACD line is below the signal line and the histogram is negative. Moreover, the MACD weakness is seen from much above the 0 line indicating that we could see some more price weakness.
The RSI has started declining before reaching overbought levels. It currently sits at 55 which is still not indicating weak momentum. The important observation here is that as the $SPX price went up, the RSI indicated a divergence. This divergence was already seen before last week. So, not surprising that last week was a down week.
Overall, my assessment is that $SPX is certainly weaker over the last 2 weeks. I would call the trending neutral as of now because the moving averages are still indicating bullish trending but the MACD is indicating bearish trending.
We are at a decision point here. If market goes down next week, the bearish reversal could get confirmed. If the market does go up, that may be the end of the current weakness and we remain in a bullish trend.
=====
SPX Underlying
As of the end of Week 25
65.8% of the $SPX underlying stocks have their price over their 50-day moving average. That is down from 70% the prior week.
44.9% of the $SPX underlying stocks have their price over their 200-day moving average. That is down from 47.5% the prior week.
For the 20-day though there is improvement.
45.8% of the $SPX underlying stocks have their price over their 20-day moving average. That is up from 40.4% the prior week.
=====
Conclusion
So, where does that leave us overall on the $SPX?
From a medium term perspective we remain bullish as we saw in the weekly chart.
From a short-term perspective we are neutral and face potentially a decisive week where with the bullish trending will be maintained or we will see a reversal to the downside.
From a positioning perspective, I am not long any of the market indices like the $SPY, $QQQ or $IWM.
With the earnings season over, I prefer to trade the individual momentum stocks and some ETFs.


