Reading Trends and Making Decisions
The stock markets were mostly flat yesterday and seems like everyone waiting for the Fed announcement today. In pre-markets all the markets look higher. But it is anyone’s guess as to how it will close. It would appear that all the bad news is right now baked in with expectation of a 75-bps rate increase. It seems markets will be happy if that happens.
I do not go with the market thinks. I go with what the market does. In that sense my timing is always wrong, but it is right enough to capture bulk of the gains and minimize the losses.
Short-Term Trends
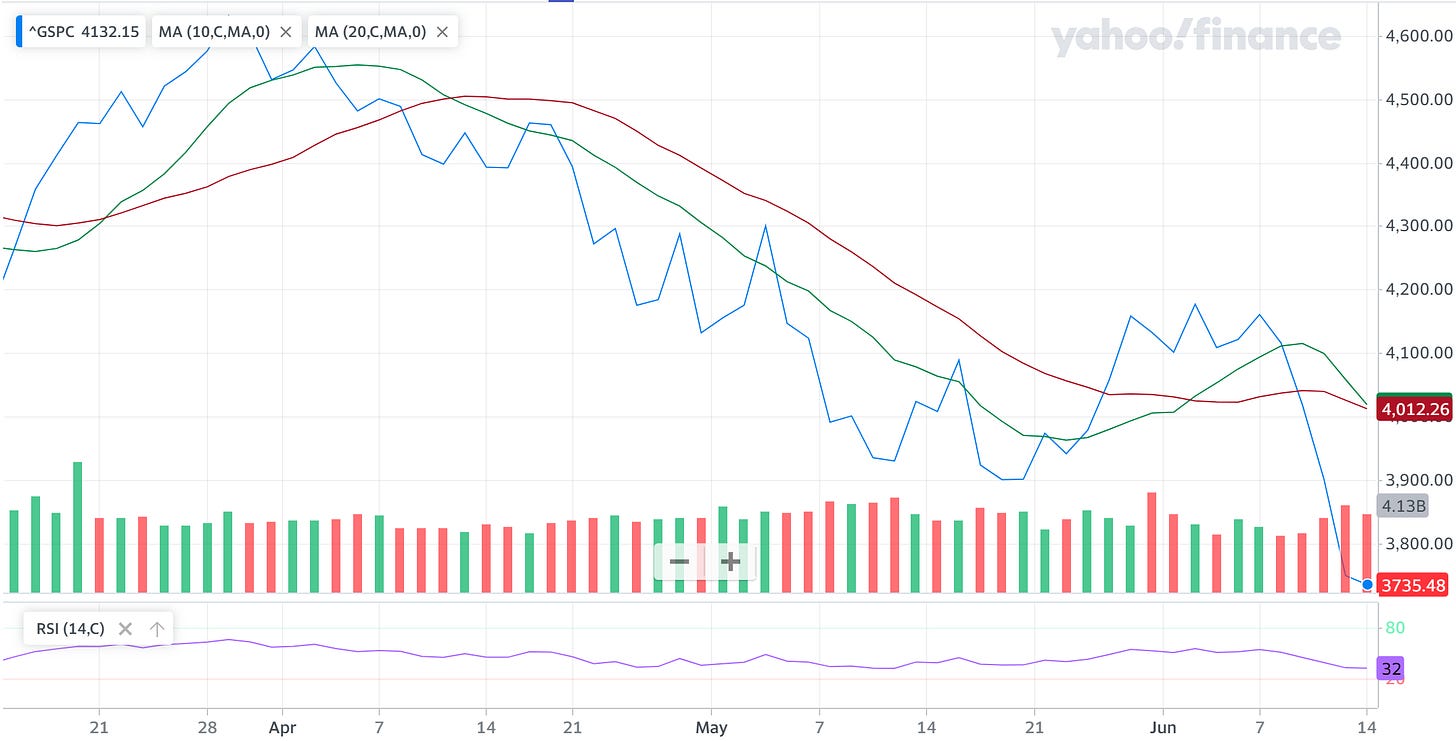
Let us look first at the short-term chart of S&P 500 to illustrate what I mean.
Note that by short-term I really mean short-term indicators. The above chart is a 3-month chart of the S&P 500 price along-with the 10-day simple moving average (SMA) in green line and the 20-day SMA in red line. The colors of these lines are for me to buy when the green line crosses over the red line and to sell when the green line crosses below the red line.
We can see clearly that the green line is currently only slightly above the red line. In my model this is still short-term bullish indicator. However, it is clear that, barring any miracle, the green line will cross below the red line most likely sometime this week. This is because the lines are moving averages. Even if we have a huge up day today the moving average over 10 days will likely still keep going down for a bit.
This is what I mean by I will always be wrong in predicting the market. But I will be very good in following the market. Which is really what my model is. The most difficult thing to do is to follow the model. It is very tempting to say that clearly the green line is going to cross below the red line soon. So, why not avoid more losses and sell early. But that would be predicting. And I don’t want to do that. In the past, there have been several occasions when what seems as obvious to happen has actually not happened. So, I wait for actual events.
So, going by this, I am still going to hold on to my positions for now.
Long-Term Trends
Now, for a bigger picture, I want to use the same 3-month chart of S&P 500 but plot the longer-term trend indicators.
In the above 3-month chart of the S&P 500, I have plotted the 50-day SMA in green and the 200-day SMA in red. Again, the color of the lines is indicative of what my models are about. If the green is over the red, the overall long-term trend is bullish. If the green is below the red, the overall long-term trend is bearish. We can see that currently the green is below the red. So, we are in a long-term bearish trend.
Making Decisions
What this means per my model is that we have been in a short-term bullish phase within a long-term bearish market. This does not change what I do. But it does change the volume of what I do.
I only deploy between 25-50% of my money in the markets in situations where the short-term trend is bullish, and the long-term trend is bearish. I deploy the rest of the money if and when the long-term trend also turns bullish.
Conclusions
The above is a brief description of my model or system based on a lot of back testing that I have done. It works well for me. I am not suggesting this is the only system that works. Or this is the best among all the systems. This works for me. I am not suggesting anyone should follow this although they can and will get decent returns. I am suggesting everyone should think about using a system. It could be this one (definitely not financial advice) or one that they create and feel comfortable with.


