


Major Stock Markets Trending and Performance
It was an up week so let us see how the trending heat map looks like. Very encouraging actually.

The S&P 500 was perfectly bearish last week. Now we can see that the price has crossed over the 10-day and the 20-day moving average. I still need to see the 10-day crossing over the 20-day moving average for the short-term trend to reverse to bullish. But good strength this week.
The Dow Jones, on the other hand, has actually turned short-term bullish. As we can see not only has the price crossed over the 10-day and 20-day moving averages, but the 10-day has crossed over the 20-day moving average. Note that the price is also very close to crossing over the 50-day moving average. That is very good strength, and the Dow Jones could be the leader who starts the market reversal.
The NASDAQ is similar to the S&P 500 and so is the NASDAQ 100 (QQQ).
The Russell 2000 already had the 10-day moving average over the 20-day moving average from last week. This week the price has also crossed the 10-day and the 20-day moving averages. So, similar to the Dow Jones, the Russell 2000 is also leading the market in the short-term bullish reversal.
The Emerging Markets also is similar to the S&P 500 with the price crossing over the 10-day and 20-day moving averages.
I added the All-Country World Index to this list of major markets as well and, as we can see, it is keeping up with the rest of the major markets.
Now, let us look at the performance starting with the week over week ROI.
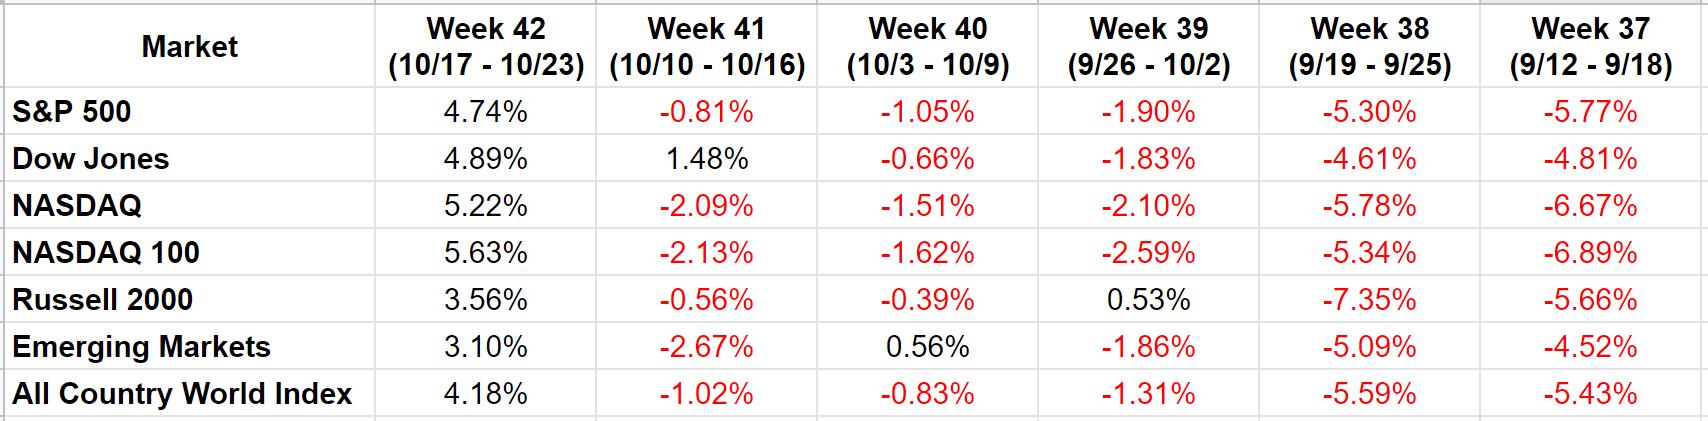
A perfect situation this week with all the major markets nicely up. But, as we can see, that is after 5 prior weeks of losses. So, clearly the markets were due for a bounce. What we have to see is if the bounce was a sympathy bounce or a true change in market sentiment.
Here is another way to look at ROI.

Good October so far. Also, the Dow Jones and the Russell 2000 are positive over 1-month trailing. This confirms from the trending heat map above that they are the leaders in the current market. Interestingly, the NASDAQ is twice as worse off than the Dow Jones over year-to-date.
Just to complete the analysis, here is the 3-month chart of the S&P 500.

Conclusions:
The markets had a good bounce this week. However, it was after 5 straight weeks of losses. So, it could be what is known as a dead cat bounce.
Dow Jones and Russell 2000 are the leaders over the last month or so and they need to continue performing well if we want to see a meaningful reversal to the bullish side.
Looking at the technical chart for the S&P 500, the price closed at 3752 which is around the same as the close earlier on Tuesday 10/18. The support and resistance lines are at 3610 and 3825. So, the current price is around the middle of that band.
This is the 4th attempt by the S&P 500 within the last 3 months to reverse to the upside. It has failed in the prior 3 attempts. So, is this it?