


Major Markets Charts check-in
Markets recovered from a bad start to the day today to end mostly even. The VIX was up +3% but is still under 19 which bodes well for the markets. Here are how the charts for the major instruments I am tracking are looking like:
SPX

The price keeps hovering around the top of the wedge (lines drawn in red). With the trending being perfectly bullish (per my model covered here), the probability of the price breaking through above the red line is slightly higher I would say. However, that resistance band looks quite strong as well. So, I would say the odds are about even as to which direction price settles this week. There are also 2 gaps, one above and one below, that we need to pay attention to. One of them will get filled first. (I have a medium size short position for a short-term play).
QQQ
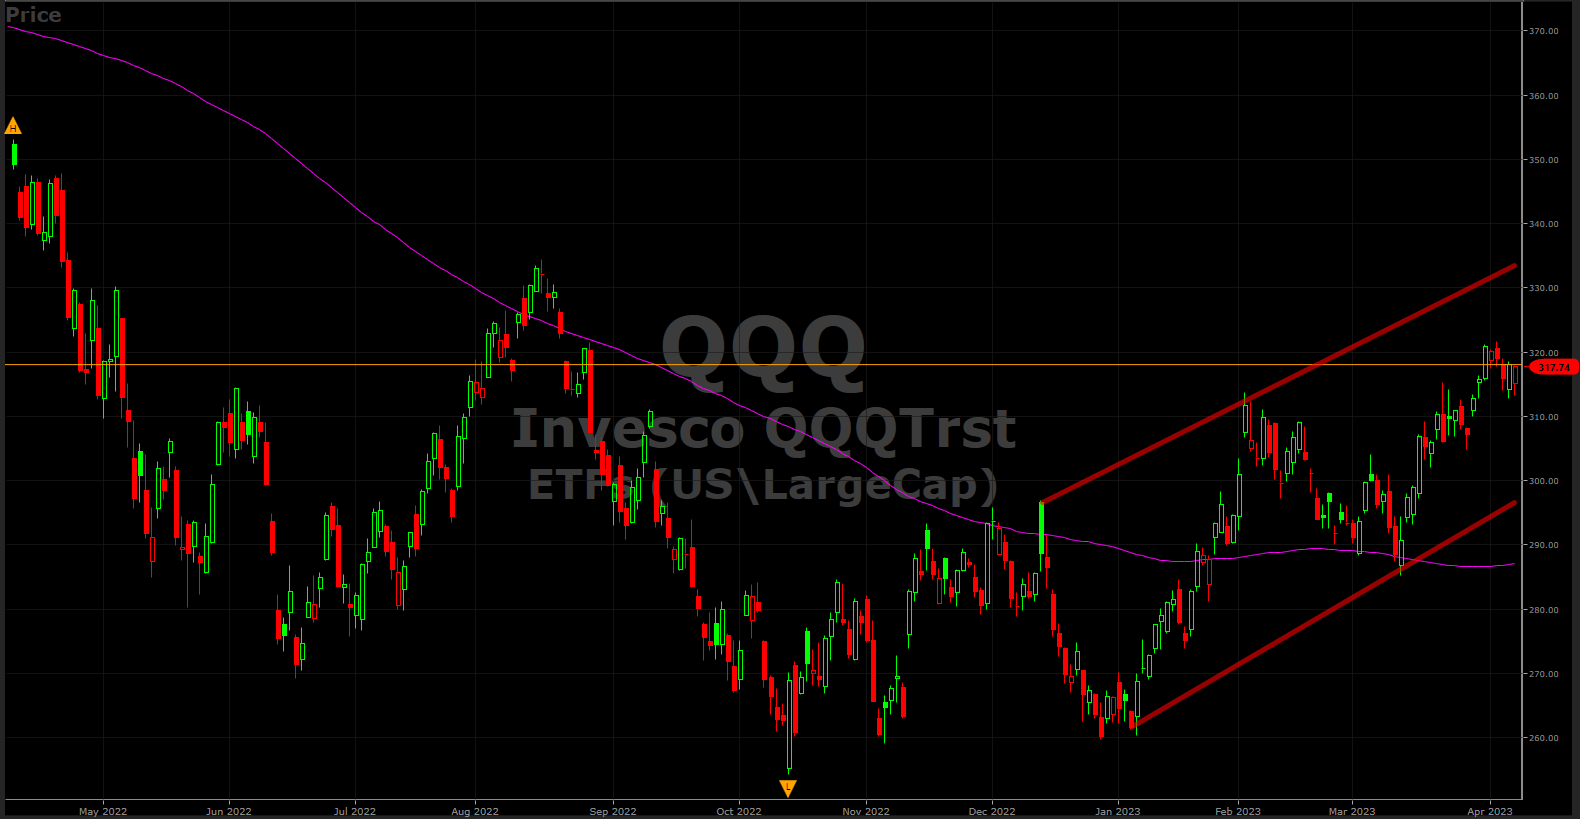
Price is hovering around the midpoint of that upward channel. So, technically it looks good. The QQQ is also trending perfectly bullish. So, the general expectation is price should be going higher. But price has gained quite a bit since the start of the year and there should be a bit of a pullback. That is what I am playing for with a small short position as of now.
IWM

I see that downward channel and price again somewhat in the midpoint of that channel. There is an overhead unfilled gap. Today, the price did close above the 10-day and the 20-day moving averages. So, now it is short-term bullish per my model. As of now, I am positioned short for the medium-term range.
Tomorrow may end up being a flat day as well since there is nothing much on the calendar. The economic data points are Wednesday and Thursday. The big bank earnings are on Friday. So, likely a lot to happen this week.