Posted this on X Sunday.
=====
As we move into Week 25 I still think that the Big Tech is key to what happens to the $SPY and $QQQ next. They have been underperformers so far this year.
The $SPY and $QQQ are flat for the year and if they are to make new hghs, Big Tech will need to step up.
In this thread 🧵I will cover the Big tech 11 I track closely: $MSFT, $NVDA, $AAPL, $AMZN, $GOOGL, $META, $TSLA, $CRWD, $AVGO, $NFLX, $NOW.
I will also cover $MAGS and $FNGS as these are the instruments that have the 11 as underlying.
So let's get started 👇
---
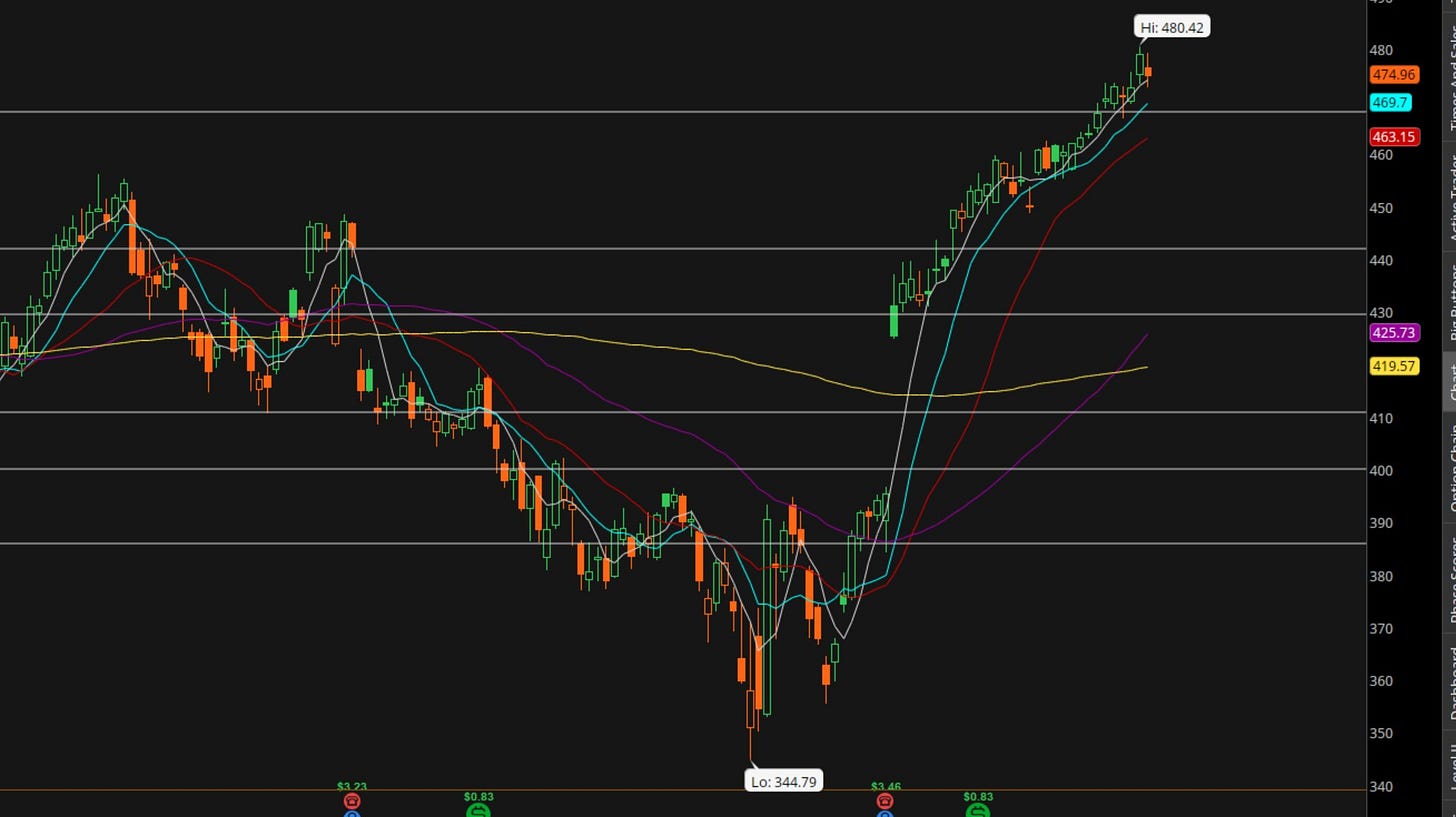
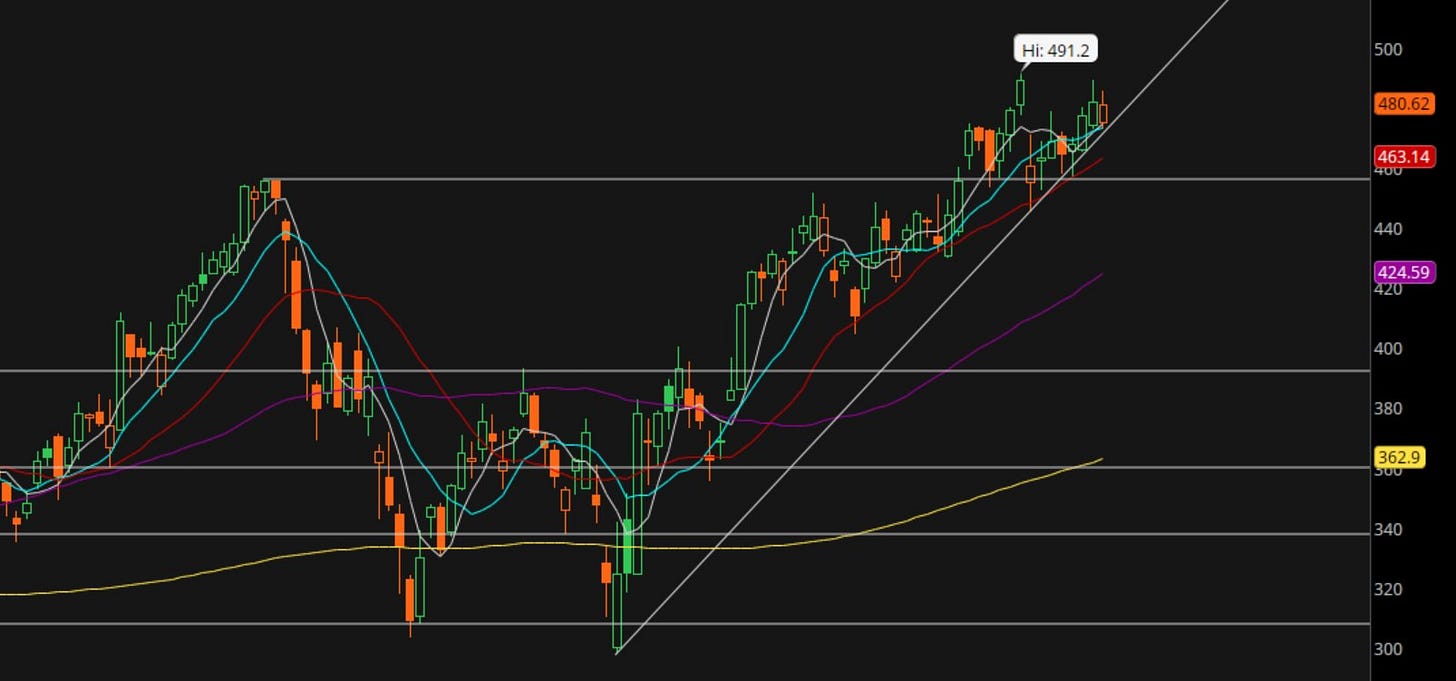
The $MSFT price action is trending bullish. It is one of only 2 of the 11 Big Tech stocks that in trending perfectly bullish.
The $MSFT price broke through resistance and made a new all-time high Thu.
It was down Fri with the rest of the stock market and I will not be surprised if does a touchback to the prior resistance which should act as support now.
That level is at around 468.
$MSFT most definitely has been a leader of late and since it is the #1 company in the world carries a lot of weight.
---
The $NVDA price has not made a new high yet but the trending remains bullish.
Also, we can see that Fri price touched the support level and bounced. So, the inclination is to go up.
Price also remains within that battlefield zone where we have seen trading volume in the past. So, I never expected $NVDA price to make new highs in a straightforward way.
Price will need to contend with this zone first but seems to me the bulls remain strong and will pull $NVDA through to new highs soon enough.
---
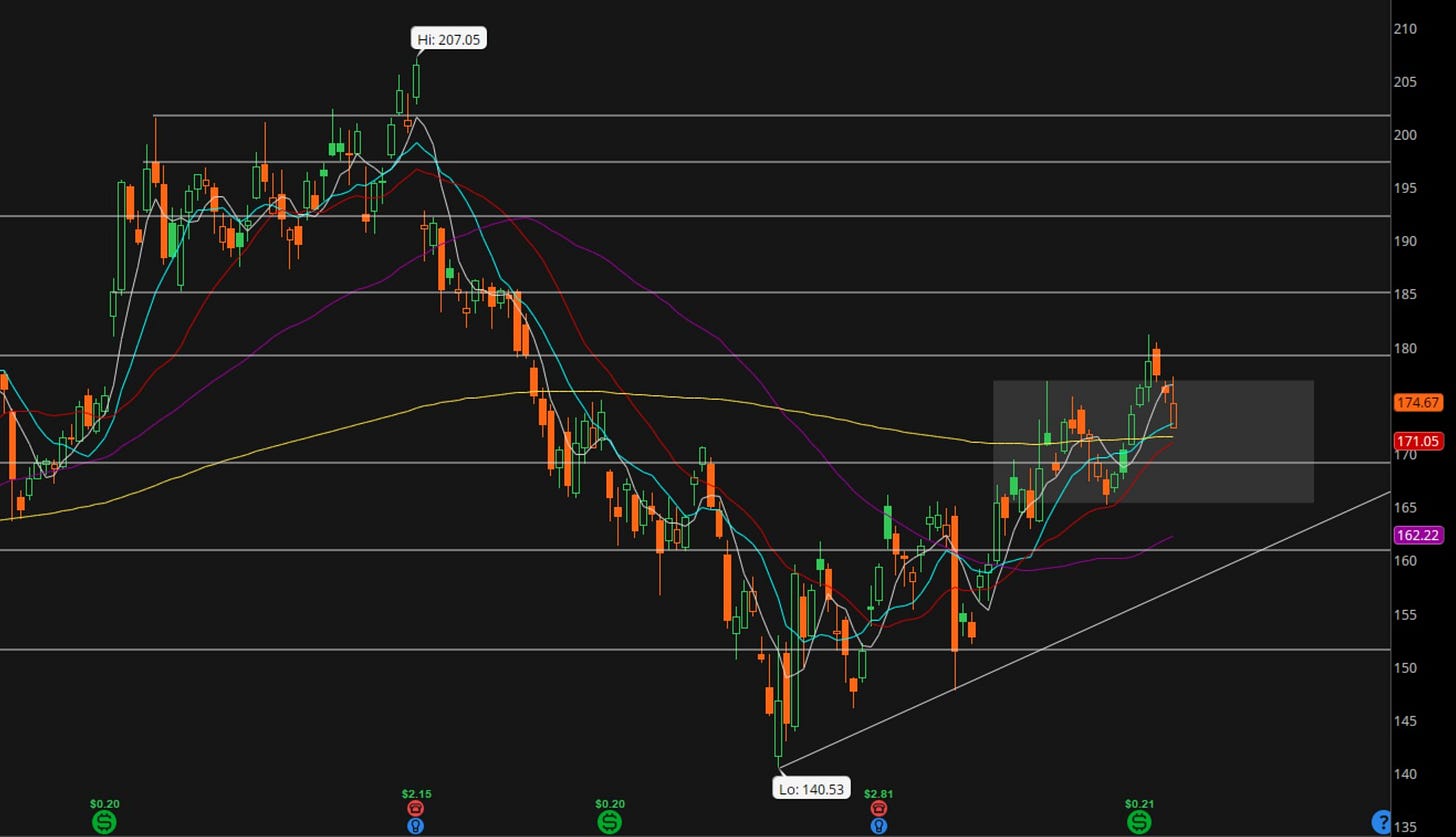
The $AAPL price has dramatically bad trending. And deservedly so as they cannot seem to get their AI act together.
Price has been range bound within that shaded area and cannot seem to come out of that.
Price is also not able to get above that descending trendline
Some will think this is the worst it can get and buy here. But that is not part of my system. I want to see it start to recover.
When price starts to climb and goes over the 20-day moving average (red) and the 20-day starts to go flat to rising - that's when I will consider $AAPL could be reversing.
---
The $AMZN price remains above the 20-day moving average (red) and the 20-day is still rising.
Price is also above the 50-day (purple) and the 200-day (yellow) and both of them are also rising.
So, I call $AMZN trending bullish.
---
The $GOOGL price is also trending bullish. Even though the price action shows it getting out and above that shaded trading zone and then falling back into it.
Price is above the 20-day moving average (red) and the 20-day is still rising.
Price continues to make higher lows and higher highs. As long as that trend continues price will be headed in the right direction.
---
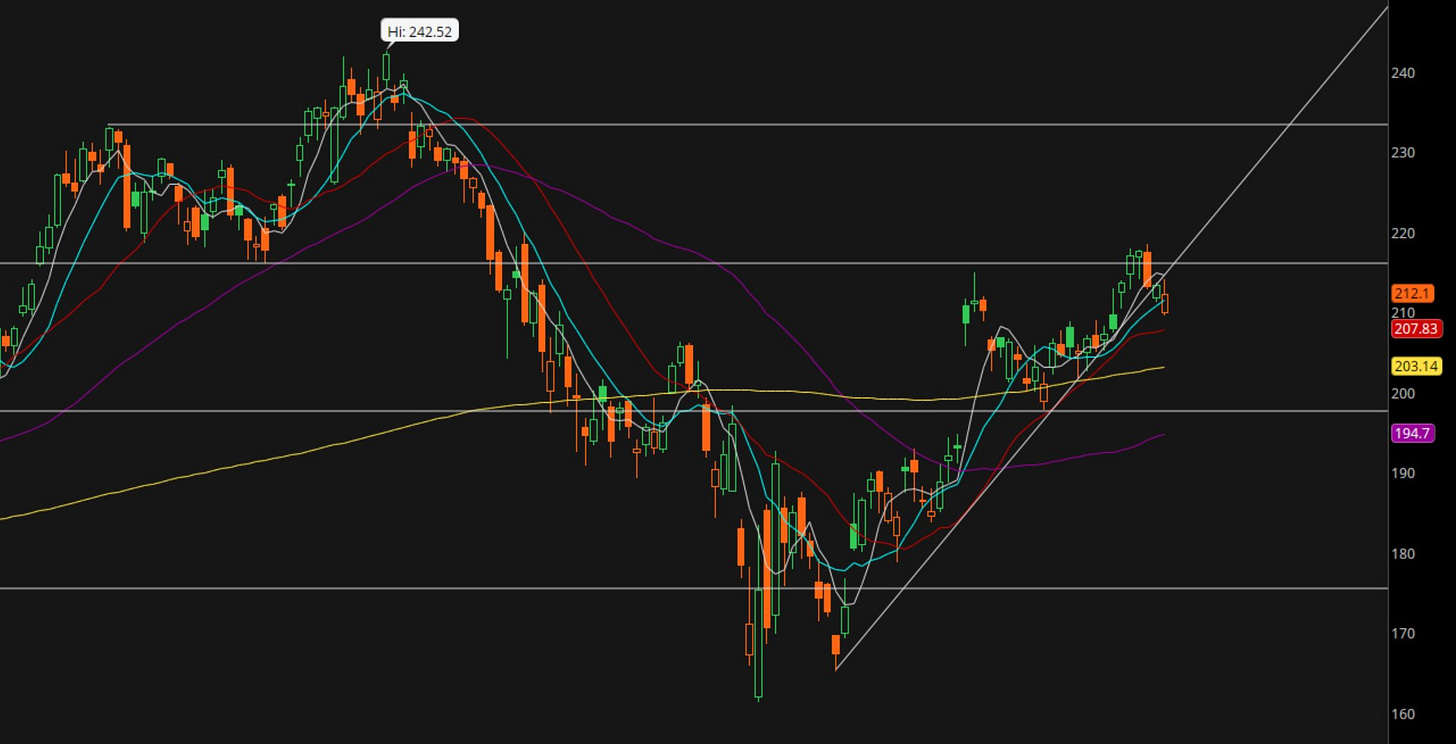
The $META price trending bullish with price making higher lows and higher highs as it climbs up.
That steep rising trendline did get breached Fri. So I will be watching next price action.
Price remains above the rising 20-day moving average (red) though. So, all good for now.
---
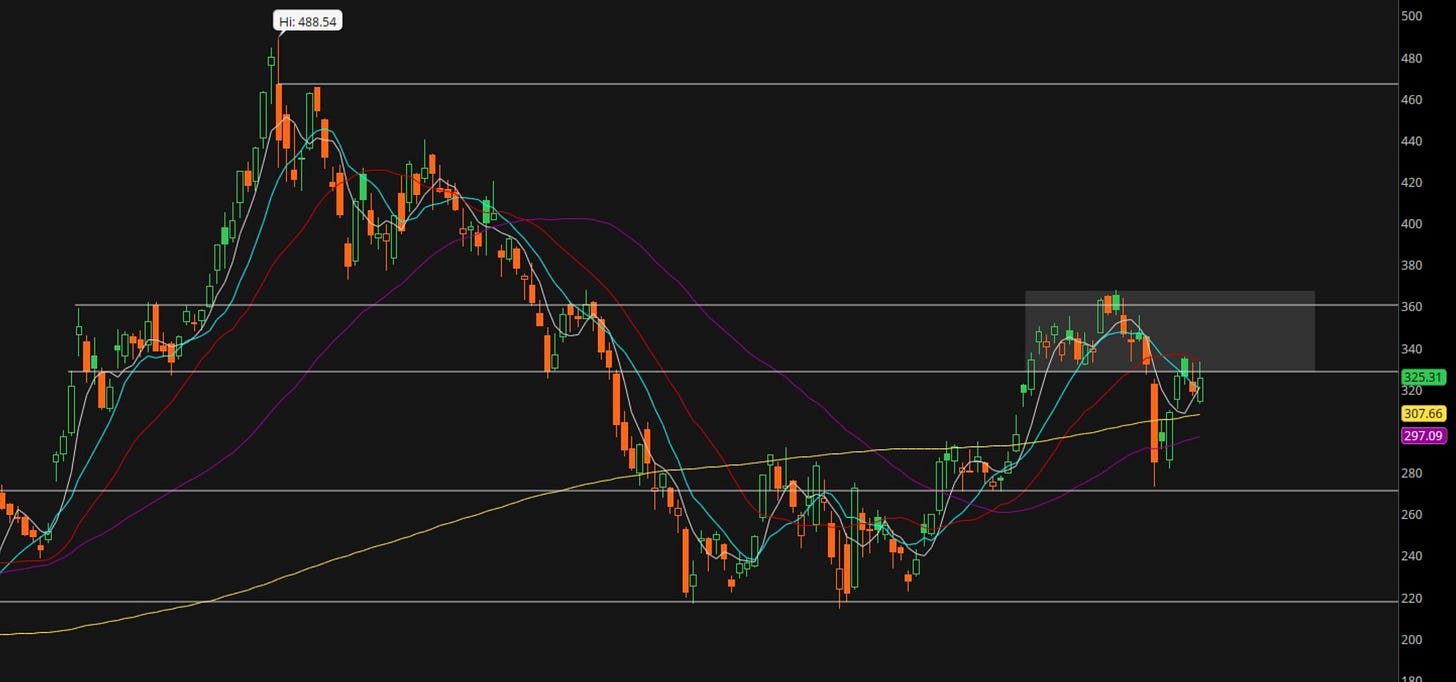
The $TSLA price is at an interesting juncture.
Price is below the 20-day moving average (red) and the 20-day is declining. That is negative.
Price is still making higher lows and higher highs. That is positive.
So, who is going to win the current battle? The bulls or the bears?
For the bulls, they have to first take price back into the shaded area where there is trading volume. Then they have to take price above and out of that zone.
For the bears, they have to take price below the 270 level where price bounced off. They have to show they can drive price to make a lower low.
Both seem doable at this point though I would give the edge to the bulls just by a little.
I am not taking any chances though. When price fell below the 20-day, I closed my long position.
I will get back if the bulls can conclusively show they can win this round.
---
The $AVGO price made new highs prior to its earnings and then post earnings gave back some of its gains.
Price is still poised in a bullish trend and above the 20-day moving average (red) which is rising.
The sequence of making higher lows and higher highs also continues. So, there is nothing to worry yet for now.
---
The $CRWD price is trending perfectly bullish - only the 2nd of 11 that are so.
Price made new highs prior to earnings, then fell a little to the support level and since then has been climbing steadily back up.
All the moving averages are perfectly aligned and there are no bears to be seen in the horizon at this time.
---
The $NFLX price is trending bullish. Just about. The price had dipped below the 20-day moving average (red) Fri but closed above it.
Price could be creating a bull flag pattern.
I am watching the price against the 20-day closely to see what happens next.
The 20-day is still rising but barely so.
---
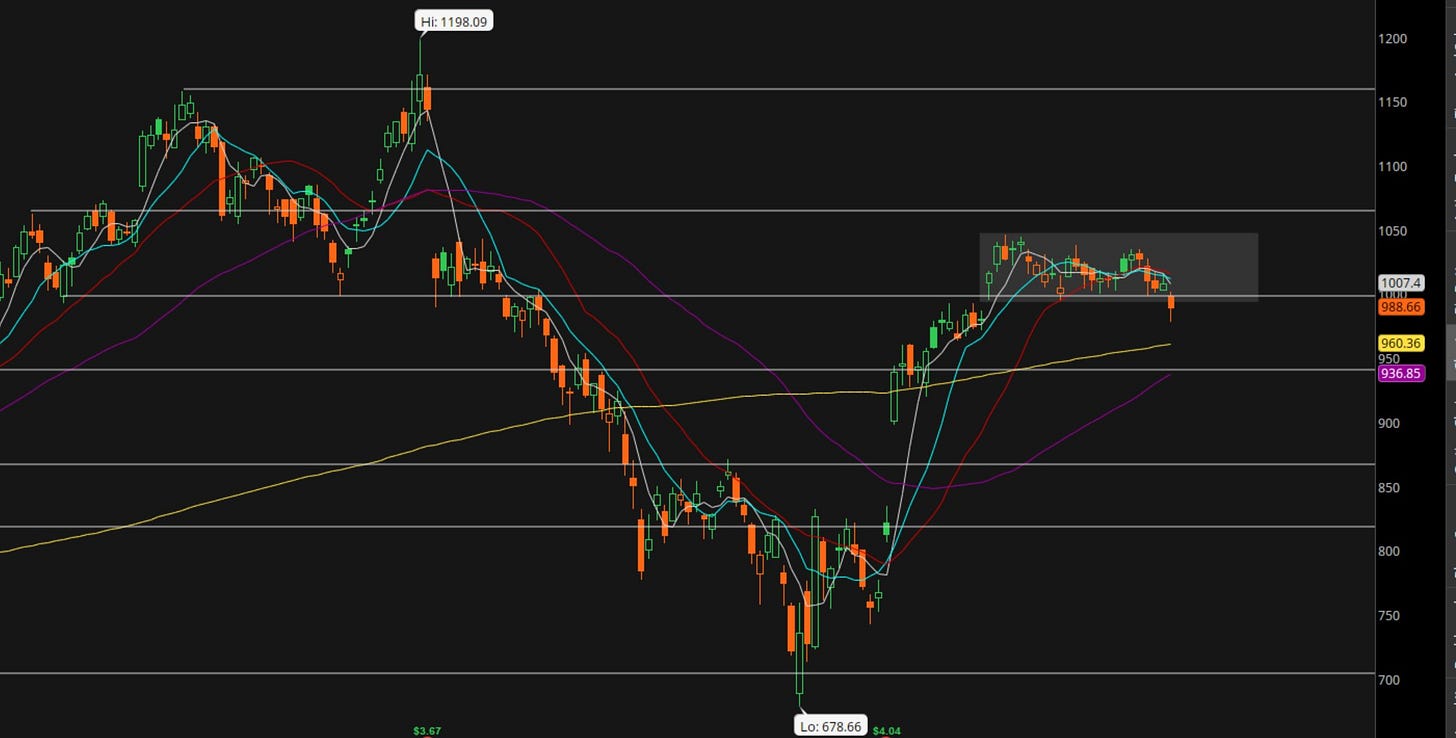
Strange to see that $NOW has not been able to maintain the AI hype that it rightfully should be able to claim.
After all, they have so much of the enterprise data as it pertains to customer support and related functions. That is a prime area for AI applications.
$NOW used to be a high-flier and that is why it was added to the $FNGS instrument. But lately price action has been quite poor.
The recent price action was looking like a bull flag pattern formation until price fell below that shaded zone.
Now it looks like price can fall all the way to the 200-day moving average (yellow).
---
So, to summarize my Big Tech 11:
$MSFT and $CRWD are trending perfectly bullish.
$NVDA, $AMZN, $GOOGL, $META, $NFLX and $AVGO are trending bullish.
$TSLA is kinda neutral.
$AAPL and $NOW are trending bearish.
So, overall, for now the bulls are ruling.
---
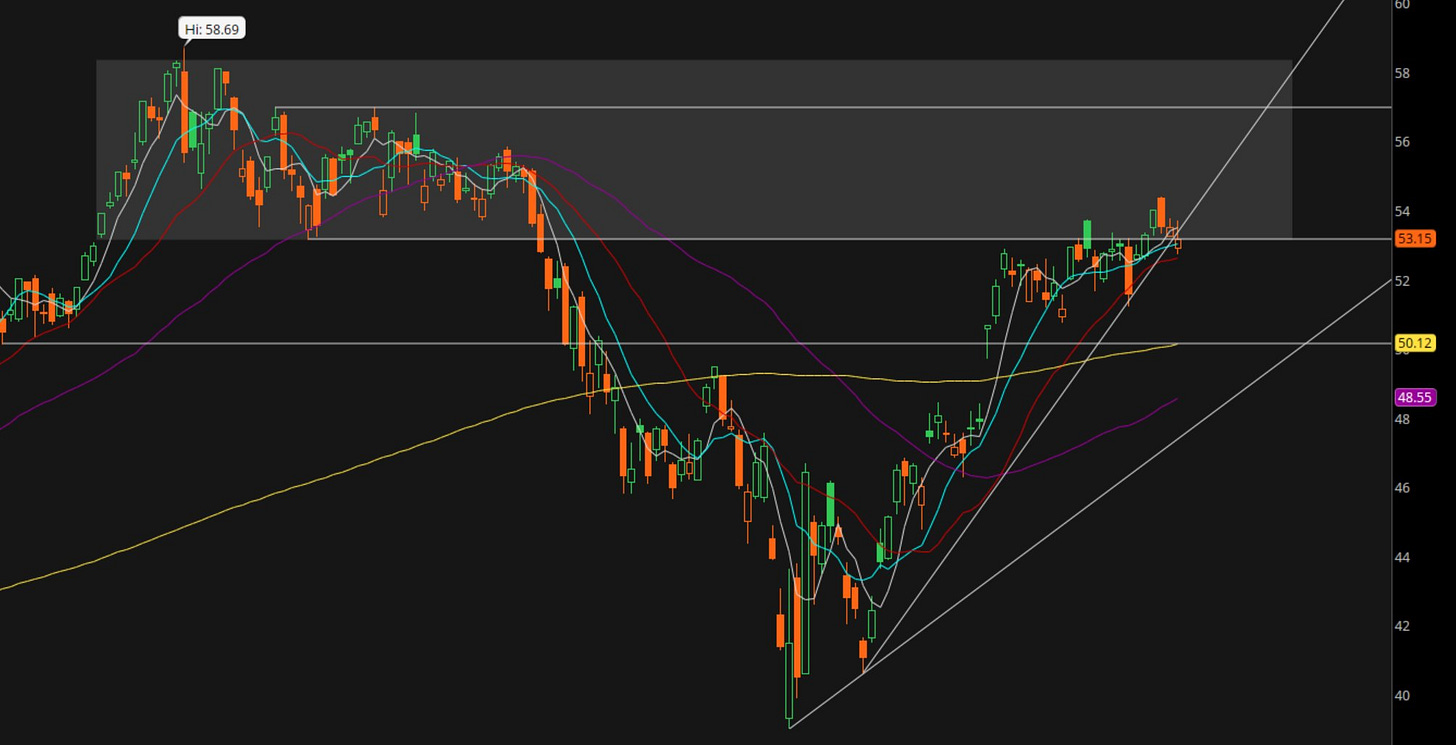
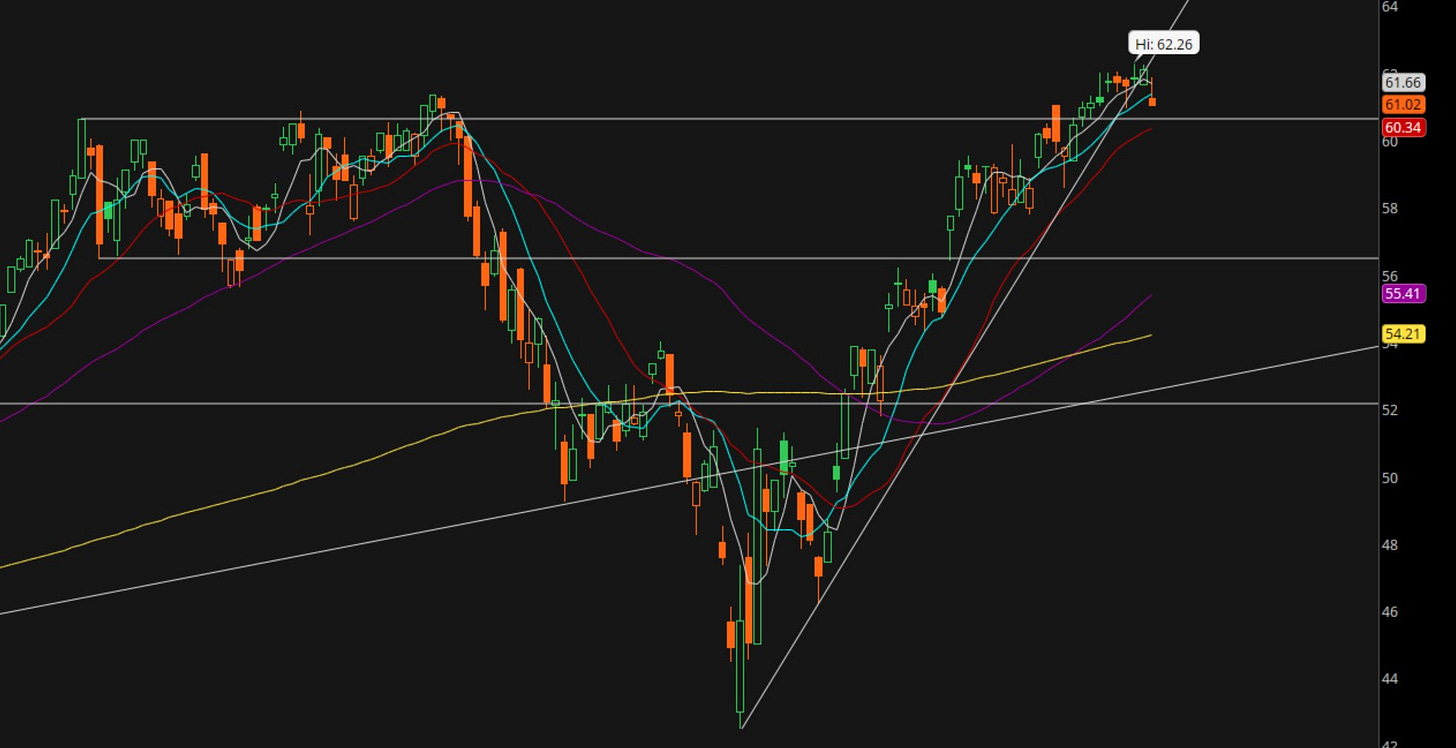
There is a big difference between the $MAGS and $FNGS though as we can see from their charts.
First chart is $MAGS where we can price above the 20-day moving average (red) but hovering below the shaded zone which is where the fight needs to be.
$FNGS (second chart) on the other hand, is clear above the trading volume zone, made new highs last week and now could be about to touch support below before moving on to new highs.
I am long $FNGB which is 3x leverage of $FNGS.
I will be sure to keep updating my analysis as the week progresses.


