Deciding when to get back in the Stock Market
Many of you, like me, have stepped over to the sidelines during this downturn in the stock markets. So, then the question arises as to when we get back in. The S&P 500 has had 5 good days and it looks set to open higher this morning judging by the pre-markets at this time. I wrote a note on “Timing the Stock Market” recently and it is time to use that in my decision-making.
S&P 500 short-term indicators
Using the S&P 500 as a benchmark of the stock markets, I will start by first looking at the short-term indicators.
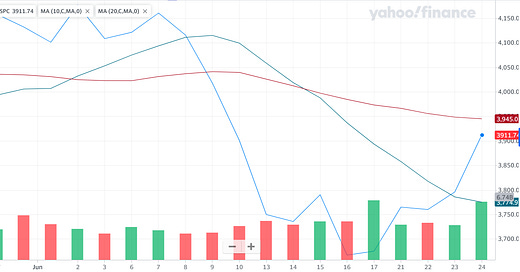
We can see the nice upswing over the last 5 days when the S&P 500 has gained +6.68% which is indeed a good bounce. In fact, 1 of those 5 days was actually a slightly down day. So, it has gained almost 7% in 4 trading days. This has also been with good volume as we can see from the bottom vertical bars.
So, is this a reversal and a strong bounce back that will continue its trajectory for the foreseeable future? Or is this 5-day bullishness going to peter out quickly and we will be back testing the recent lows. The truth is I do not know the answer. But I can read what I see and below is what I read from these short-term indicators:
The price crossed over the 10-day moving average (positive)
The 10-day is still below the 20-day moving average (negative)
The price is still well below its 1-month highs (negative)
What the above tells me is to wait and keep watching what happens next. If this is a true reversal and the price keeps going up, then very soon all of the above 3 indicators will turn positive, and I will have more conviction that the market has indeed rebounded.
If you read my timing the market note, you will know that I have decided I will not be able to pick the exact low and the exact high in the markets. But what I want to take advantage of are price trends that tell me when I can get in to make most of the gains and when I should stay away.
S&P 500 long-term indicators
Now looking at the longer-term indicators of the S&P 500
Here we can see that everything is still quite negative.
The price is below the 50-day moving average (negative)
The 50-day is below the 200-day moving average in a death cross situation (negative)
While I will not trade based on these long-term indicators, I do read them to ensure I have a full picture. What these indicators tell me is that even when all the short-term indicators turn positive, I will not go all-in. I will go up-to 50% capital in and then wait for the long-term indicators to turn positive before deploying the balance 50% capital.
Conclusions
While the last week bounce-back of the markets is healthy and positive, there is still not enough that I see in price action to get back in the markets. This week may change that. But for now, I will continue to stay in the sidelines and watch the markets develop. I realize I may end up giving up on the upside, but I feel the risk-reward is worth staying away for now.


