

Crypto: BTC and ETH assessment
I am a long-term holder of both Bitcoin and Ethereum. So, I am not looking at the price movements on a regular basis. I have no edge in crypto yet to play the trends. However, from time to time, I do apply the same trend assessment approach that I use on the stock market to the crypto market.

I look at crypto as an alternate asset class similar to commodities. Commodities have value and are useful in many ways. Crypto is the same. I do not look at crypto as currency. Although there is a chance it becomes currency one day. Today they are not. Just as gold and silver are not currencies.
Anyway, that is all philosophy and not the intent of this note. Let’s go on to the charts.
First Bitcoin with 1-month chart and short-term moving averages

The trending is bearish with the 10-day moving average below the 20-day and the 50-day. The BTC price has picked up just a bit and is now sitting on the 10-day moving average. For a bullish reversal to happen, the price needs to first cross the 45k mark which is the 20-day moving average and then cross 49k which is the 50-day moving average. So, let’s say that 50k is a reasonable level for the price to move up to for the bullish trend to develop.
Note that the 200-day moving average is just a shade below the 50-day with the 50-day diverging towards the 200-day. If the 50-day crosses below the 200-day, it would be called a “death-cross” and give the market another reason to sell.
The big climb for Bitcoin remains the 100-day moving average which currently sits at about 55k. So, price crossing that would be the real sign of the bullish reversal.
Now looking at ETH with 1-month chart and short-term moving averages

The chart and trending look similar to Bitcoin actually. The Ethereum price is close to hitting it’s 10-day moving average as well. All the short-term moving averages also look similar to those for Bitcoin. Looking at this Ethereum needs to hit 4k for me to say it has had a bullish reversal.
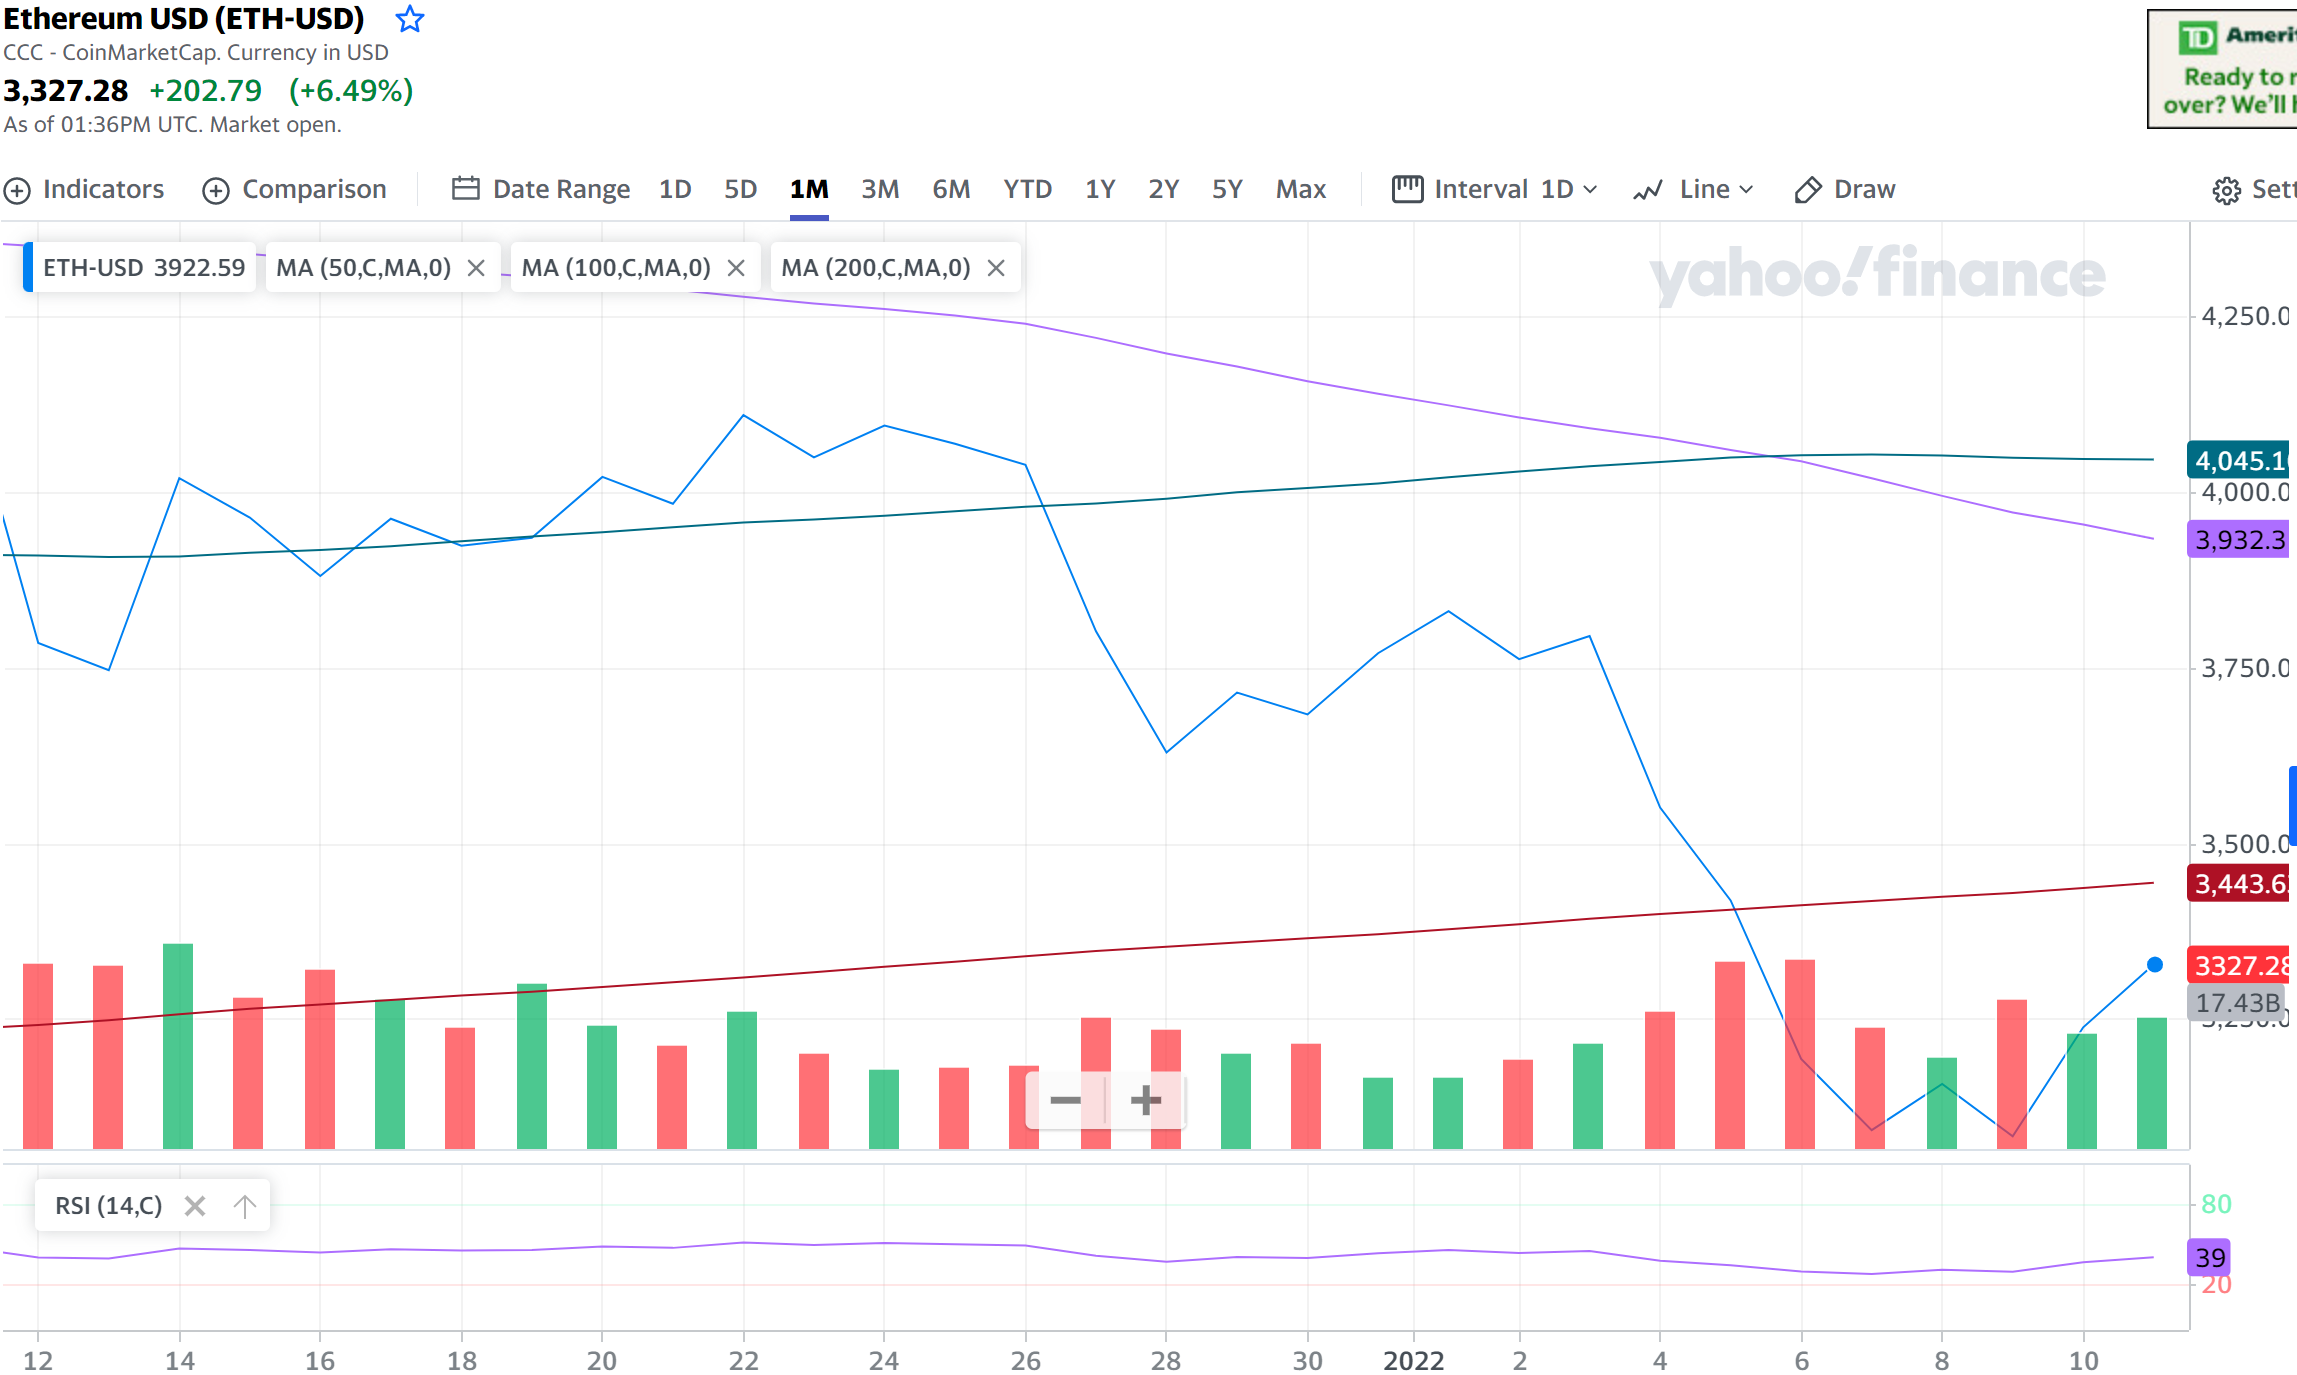
Looking at longer-term moving averages, it is a bit better than Bitcoin. The gap between the 50-day and 200-day moving averages is more and there is less chance of the death-cross at this time. The 100-day is sitting at above 4k. So, I would say 4.1k price for Ethereum would confirm the bullish reversal.
So, using rough numbers, Ethereum needs to rise +24% to confirm a bullish reversal.
Bitcoin needs to rise +28% to confirm a bullish reversal.
Now, another interesting trend that I observe is the Bitcoin to Ethereum comparison.
Plotting the BTC-ETH chart for 6-months and short-term moving averages
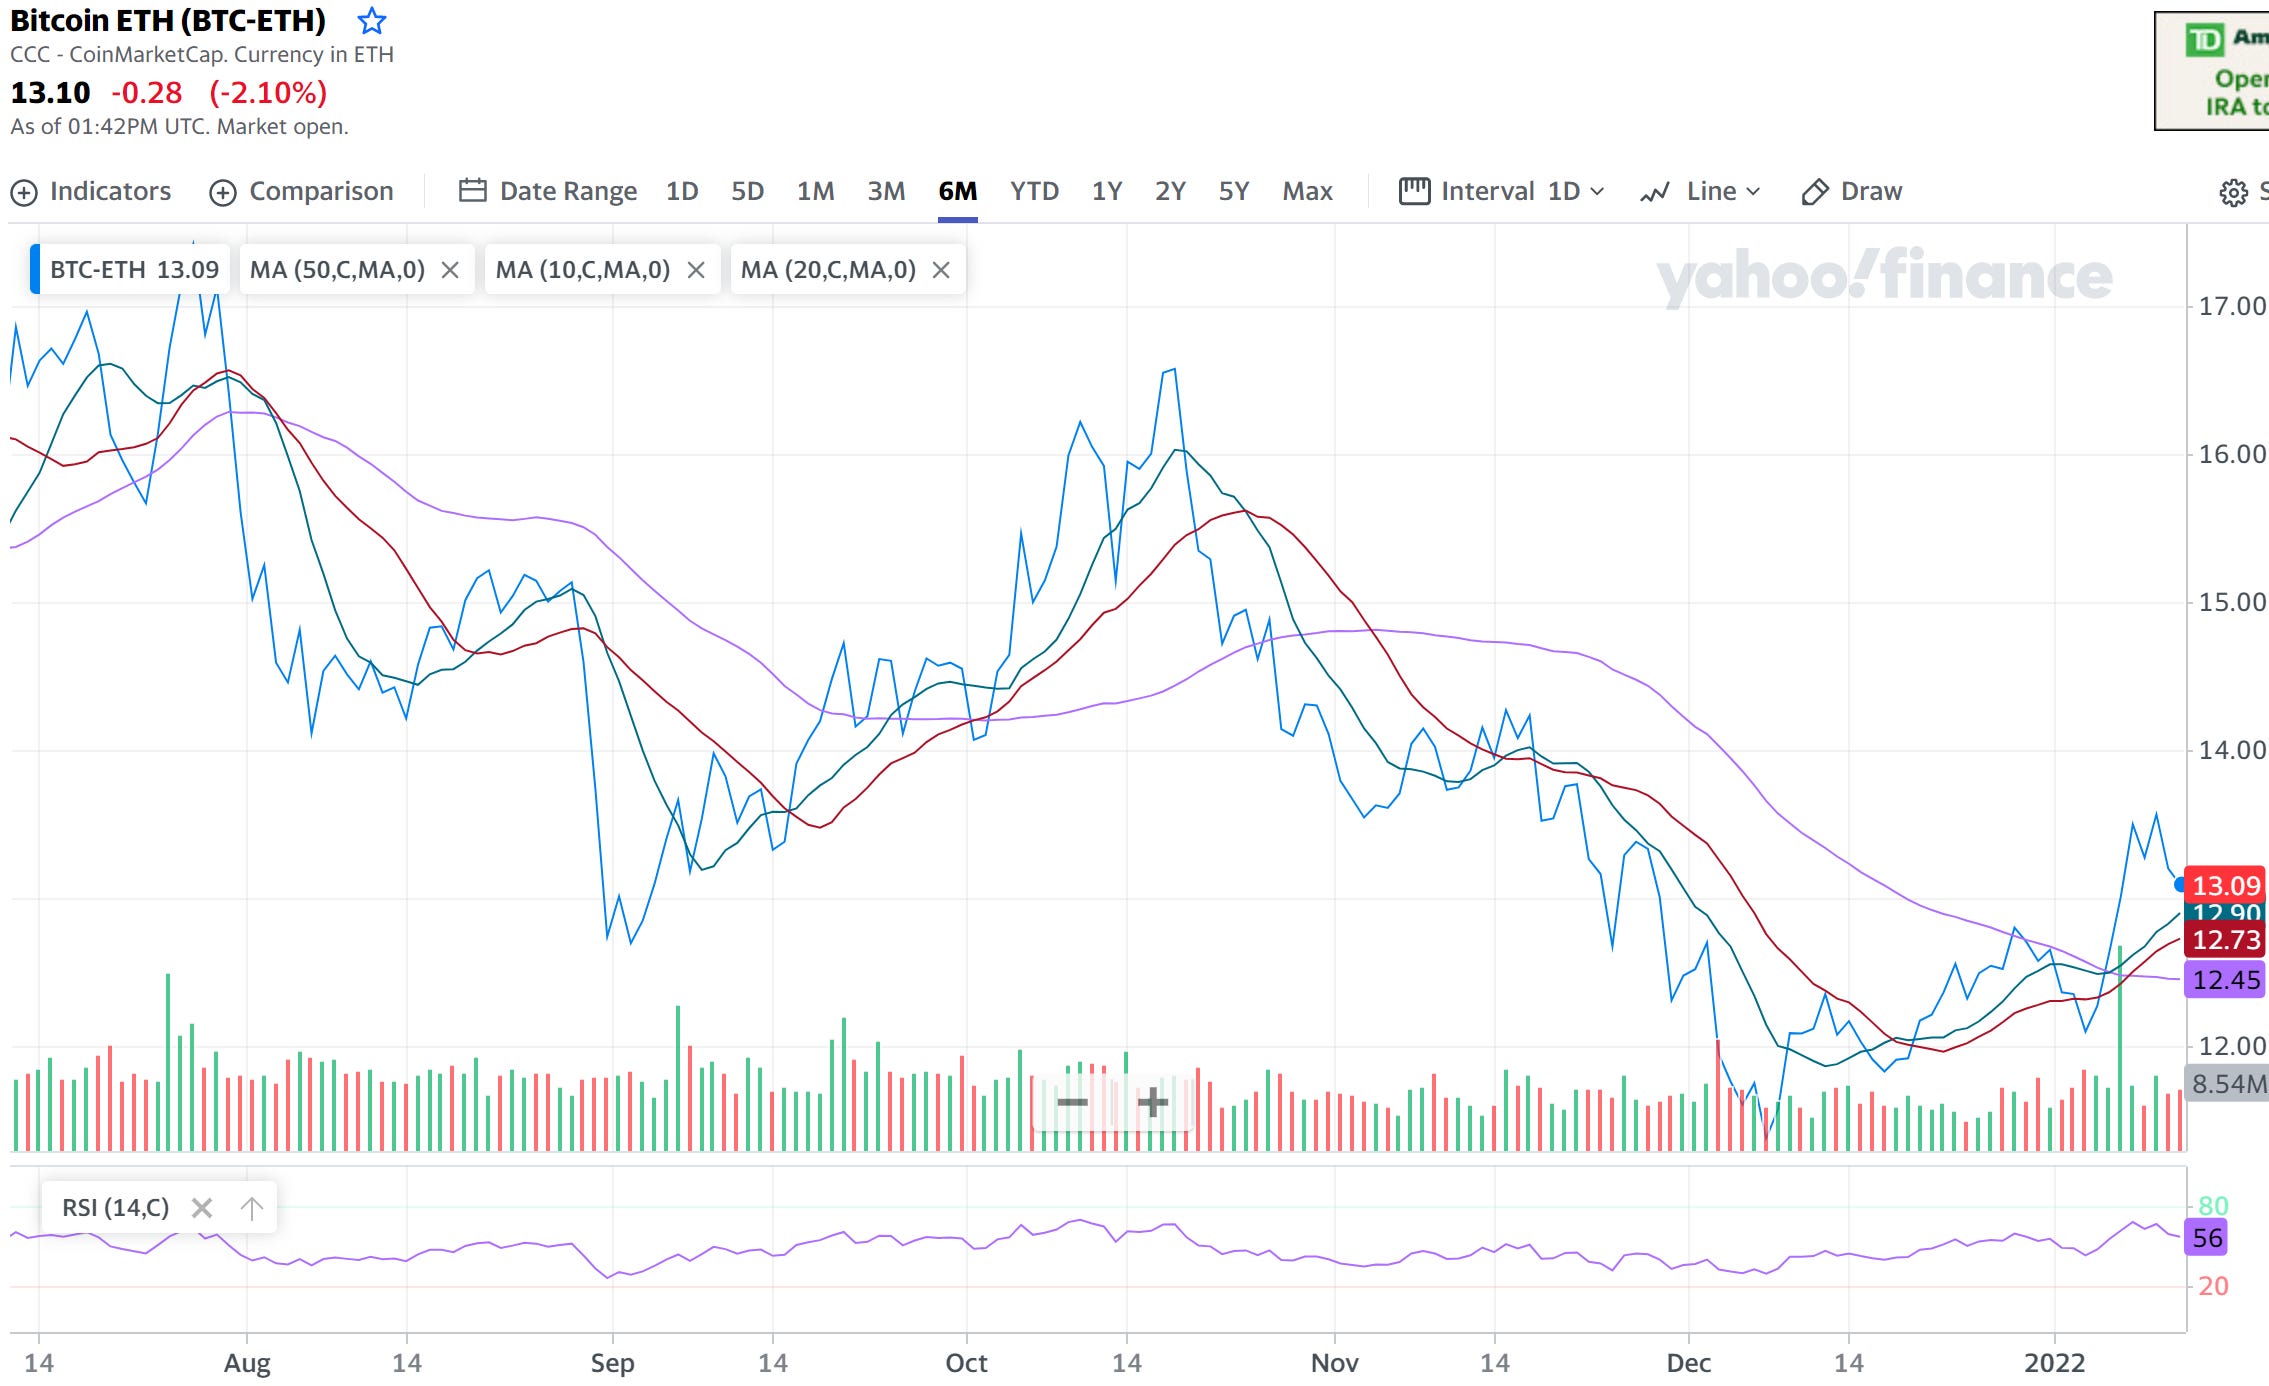
We can see that over the last 6 months Ethereum has been gaining against Bitcoin. Bitcoin used to be 17 times Ethereum and now it is 13. However, over the last month the trending of this plot has changed, and the short-term signals are indicating Bitcoin gaining back some ground against Ethereum.
Bitcoin after hitting a low of around 11 times against Ethereum has now gained to be around 13 times against Ethereum.
Also, the Bitcoin dominance against all other crypto has moved back over 40%.
Here is the interesting part. Although Bitcoin and Ethereum are still trending bearish and have a ways to go to reverse their trends, for a risk taker there are other crypto that can be more attractive.
The returns and trending for some of the other blockchains in comparison to Bitcoin and Ethereum are in the table below:

Polygon (MATIC) and Terra (LUNA) look attractive at this time.