


Checking in on the Major Stock Markets
The stock markets closed nicely higher yesterday. However, pre-markets are red this morning and there is again doubt whether we have seen the bottom or there is more to it. I wanted to check-in on a few technical indicators of all the major US stock markets.
S&P 500
Starting with the S&P 500 we can see that price is below the 10-day moving average. The upper resistance is at 3853 which is about 2.3% higher than current levels. It seems there is an equal chance of price either crossing over the resistance line above or breaking through the low reached 2 days back. The RSI bounced back from a level of around 25.

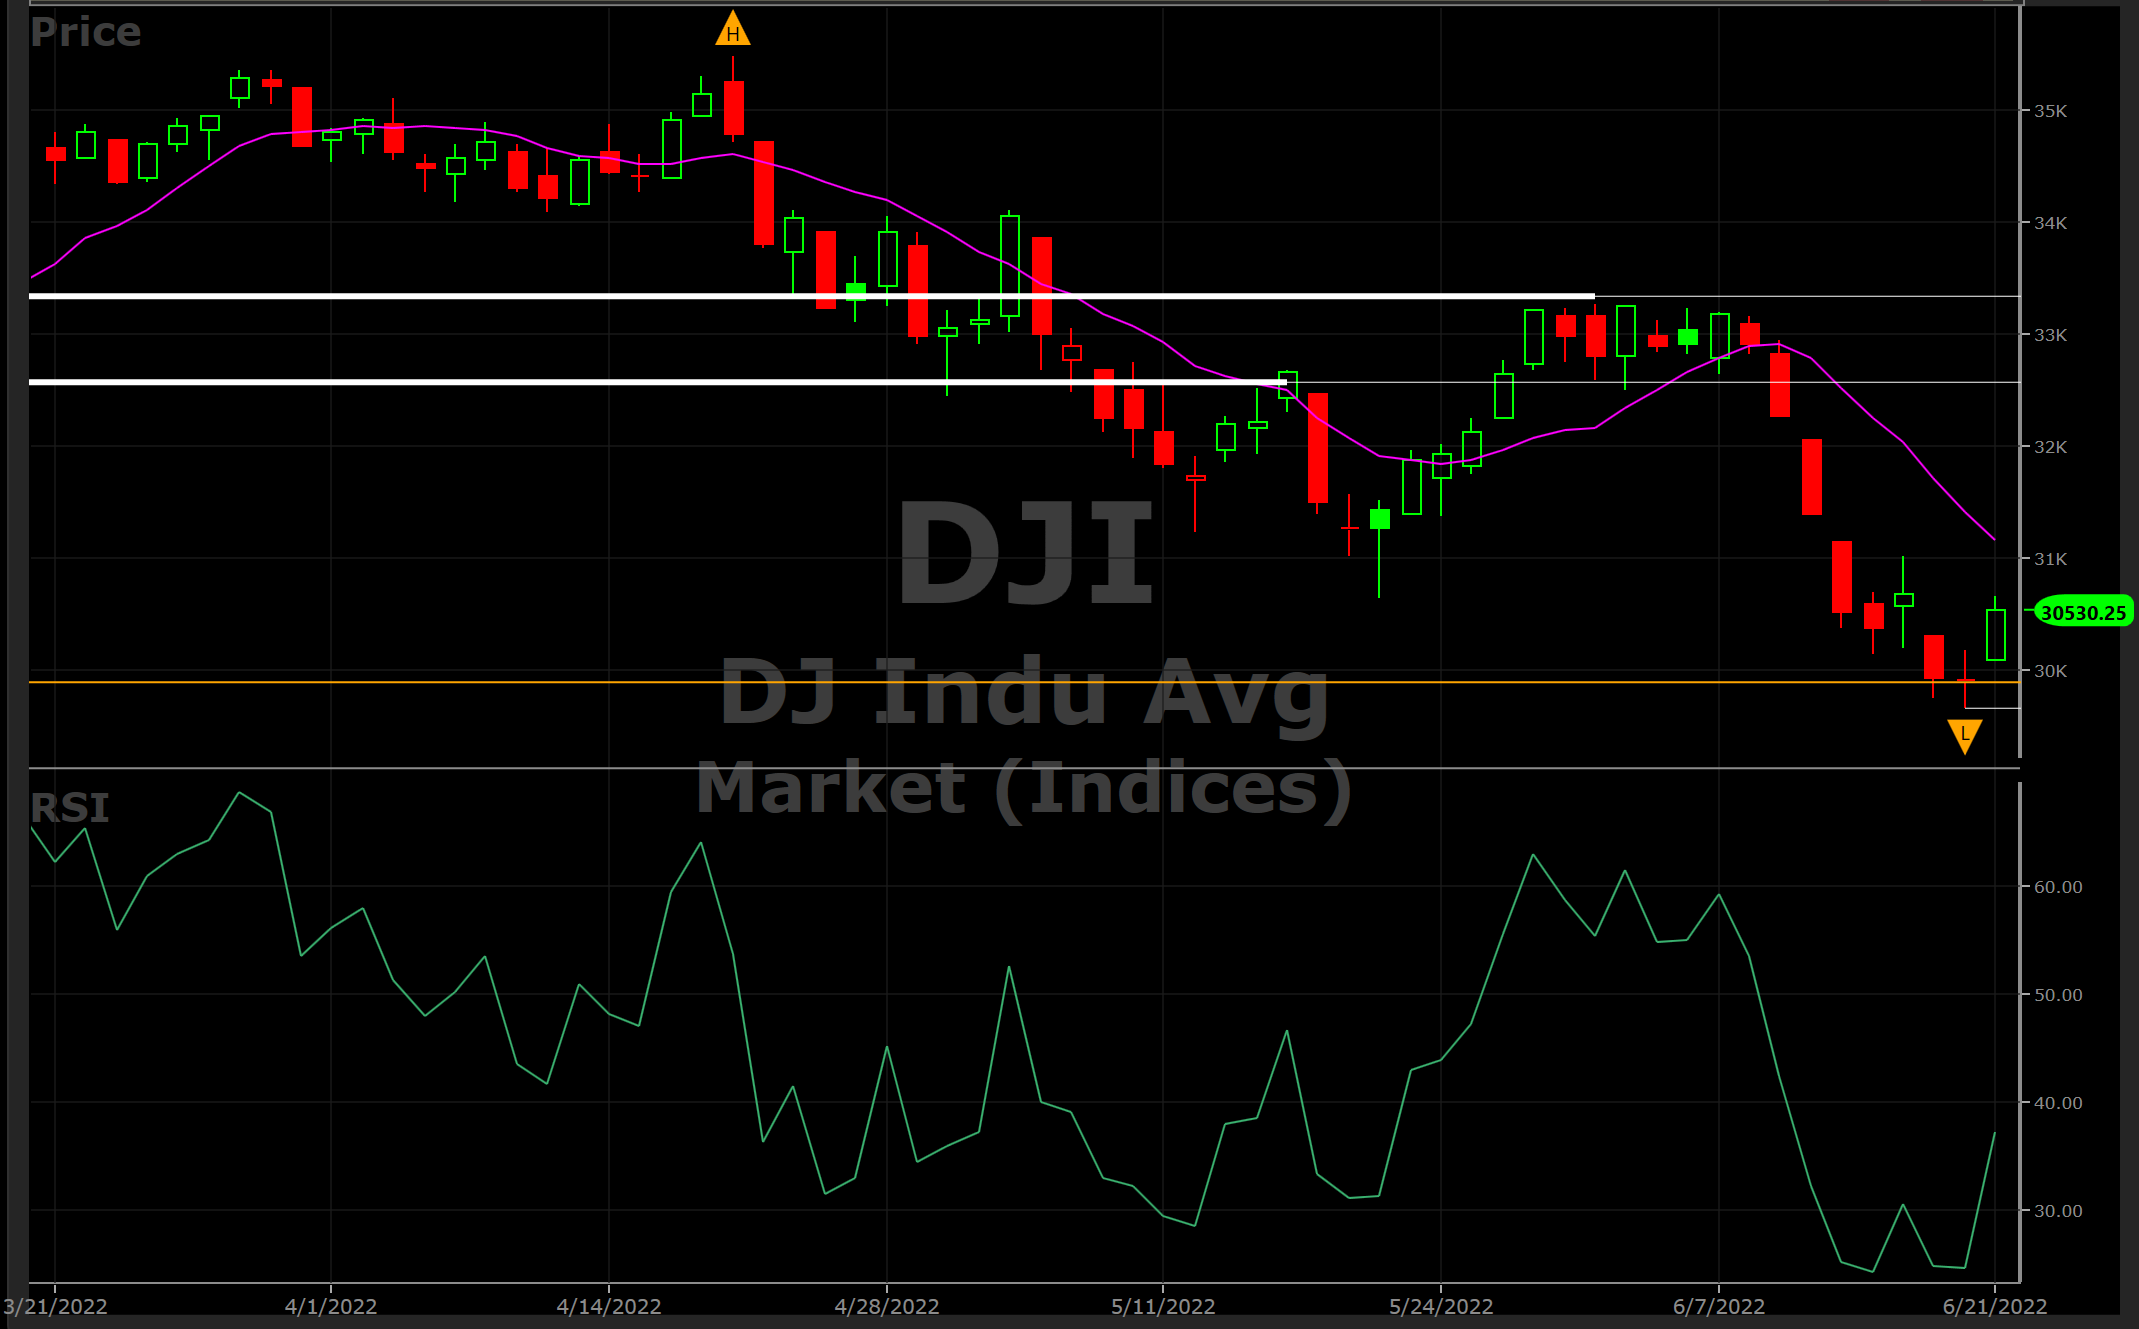
Dow Jones
Looking at the Dow Jones shows a similar picture to the S&P 500. However, the upper resistance is about 6.6% higher.
NASDAQ
Looking at the NASDAQ we see that the upper resistance is much closer to the price. It is only about 0.6% above current price.
Russell 2000
Looking at the Russell 2000 we see it is very similar to the NASDAQ. This is good because the Russell 2000 represents the broader market better.

Emerging Markets
Lastly looking at EEM (Emerging Markets) which looks the best right now as there is only 1 resistance level above. All the others we saw have 2 resistance levels which means the price has to climb to potentially reverse their trend.

Conclusion
All the above studies are telling me that there is no way to predict which direction the markets will go. So, a trader has to really play the market on a day-to-day basis. I went long some puts yesterday which I may cash out on today based on early market indicators. The trend is still down and there is no technical indicator yet that we have reached the bottom.