Avoiding Pain in the Stock Market
Yesterday was another down day in the stock markets. In fact, a really big down day. The Dow Jones was down -3.57%, the S&P 500 -4.04% and the NASDAQ down -4.73%. Clearly the slight optimism that was developing in the market has changed to negativity again.
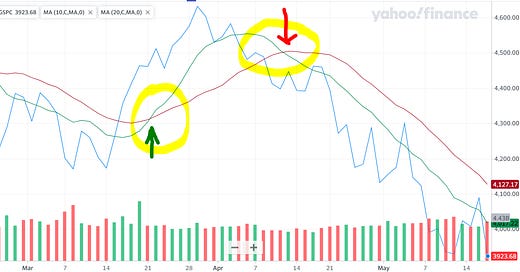
This is why I avoid predicting what is going to happen next. And that is how I avoid pain. How did I do that? Let us take a 3-month chart of S&P 500.
Aside from the S&P 500 price chart in blue, I have added the 10-day simple moving average in green and the 20-day moving average in red. I have hand-drawn in yellow the points at which the 10-day SMA has crossed over the 20-day SMA and vice versa.
The simple rules are:
I get in the market when the 10-day SMA crosses above the 20-day SMA (green arrow in picture)
I hold my position as long as the 10-day SMA stays above the 20-day SMA
I sell my position when the 10-day SMA crosses below the 20-day SMA (red arrow in picture)
Repeat this and stick to it
You will see that this allowed me to be in the market when there were indications of a bounce-back. But the rules quickly got me out of the market when the indicators turned negative.
Note that in this instance I made a small loss because even though in the chart the entry point looks lower than the exit point, in reality it is not. The reason is I wait for the actual crossovers and do not jump before that. That way the signals are confirmed, and I can avoid head fakes.
The S&P 500 is down -11% since the red arrow where the 10-day SMA crossed below the 20-day SMA. But I was able to get out with a small loss. This is how I avoided the pain.
One more thing to note is that I use leveraged instruments for these trades. For S&P 500 I use SPXL which is 3x leverage of the S&P 500. There is obviously higher risk and higher reward in using leveraged instruments. But I am able to do it because of the conviction I have in the model.


