


2023 Half Year Major Markets Review
This is the performance looking back.
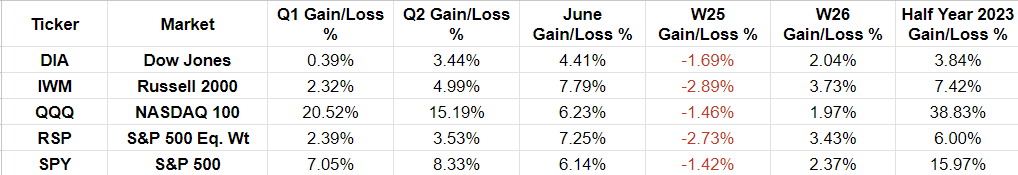
Note the RSP is the S&P 500 equal weight index which provides us information on how all the 500 stocks are doing and not just the top 7 like the SPY does.
Looking at the Q1 and Q2 numbers the NASDAQ 100 is the clear winner among the winners. Looking at the June numbers we can see that the others (especially the IWM and the RSP) are trying to catch up. And looking at the half year numbers we can see that the others still have a lot of catching up to do.
Let’s look at the trends to understand what could happen in the future.

I look at the 10- and 20-day moving averages to assess the short-term trend and the 50- and 200-day moving averages to assess the long-term trend. An all-green row indicates a perfectly bullish trend.
So, right now we have all but the IWM in perfectly bullish trend. That indicates that the bull run should continue at least for the near term. Markets go in cycles though and never in a straight line. So, we should expect some weakness, minor or major, in the near future.
The first signs of weakness will be indicated by the short-term indicators which is the price movement around the 10- and 20-day moving averages. The price will fall below the 10-day moving average first, then the 20-day moving average and so on across the columns from left to right.
Note that just because price goes below the 10-day moving average does not necessarily mean it will next go below the 20-day moving average. It can turn back over the 10-day moving average and the cell in the table can turn green again. In fact, that is what happened over the last week.
Of course, the 10-day and the 20-day moving averages are important only if we are playing the markets in the short-term. For folks playing for the longer term the 50-day and 200-day moving averages are much more meaningful.
Let’s look at the charts. Note that I look at charts primarily for making short-term trades, so it is a short-term assessment.
QQQ 3-month

The white lines are gaps. The blue lines are the Fibonacci retracement levels. The red line is the recent high indicating the current resistance level. The purple curved line is the automated 150-day moving average.
There is an unfilled gap from the move up Friday (last trading day). This is at 364.89 which is -1.23% below current price. There is a good chance this gap gets filled soon although it does not have to. There is a sentiment brewing among some that the QQQ is overdone. But unless that sentiment is manifested in the price movement, it means nothing.
Note that the MACD is indicating a reversal for a few days. But again, the follow-through has not been emphatic so far. The price is also way above the 150-day moving average and a check-back can be expected. That too has been seen for a while now without any impact to price.
So, while there are indications that price should be getting weak, the price keeps going higher. The reasons are not important. Only the price movement is. I am currently positioned short.
SPY 3-month

The price movement from Friday has created an unfilled gap at 438.28 which is -1.13% below current price. I have marked out the range of 430 - 443 using 2 red lines as I see that could be the trading range. We do see that price hit the 443 level which was the prior recent high and then stalled.
IWM 3-month

Price has climbed 5 days in a row and hit resistance around 188. The read can be very simple: if it breaks through the 188 level it goes higher on to 195 and beyond; if it cannot break through 188 and goes down it can go all the way back to 176 to fill the first gap below.